


USD/CAD Price Outlook
Have you checked the Q3 USD and Gold forecasts download for free main currencies and commodities trading guides.
USD/CAD – The Buyer’s Come Back
On July 26, USD/CAD closed with a Doji pattern indicating to a possible risk of reversal. On Wednesday, the price dropped to the boundary of 1.3100 handle. However, the buyers took charge after, sending the pair yesterday to its highest levels in six weeks.
This week, the Relative Strength Index (RSI) rebounded from 50 then pointed higher emphasizing the seller’s lack of momentum to start a fresh downside move.
Having trouble with your trading strategy? Here’s the #1 Mistake That Traders Make
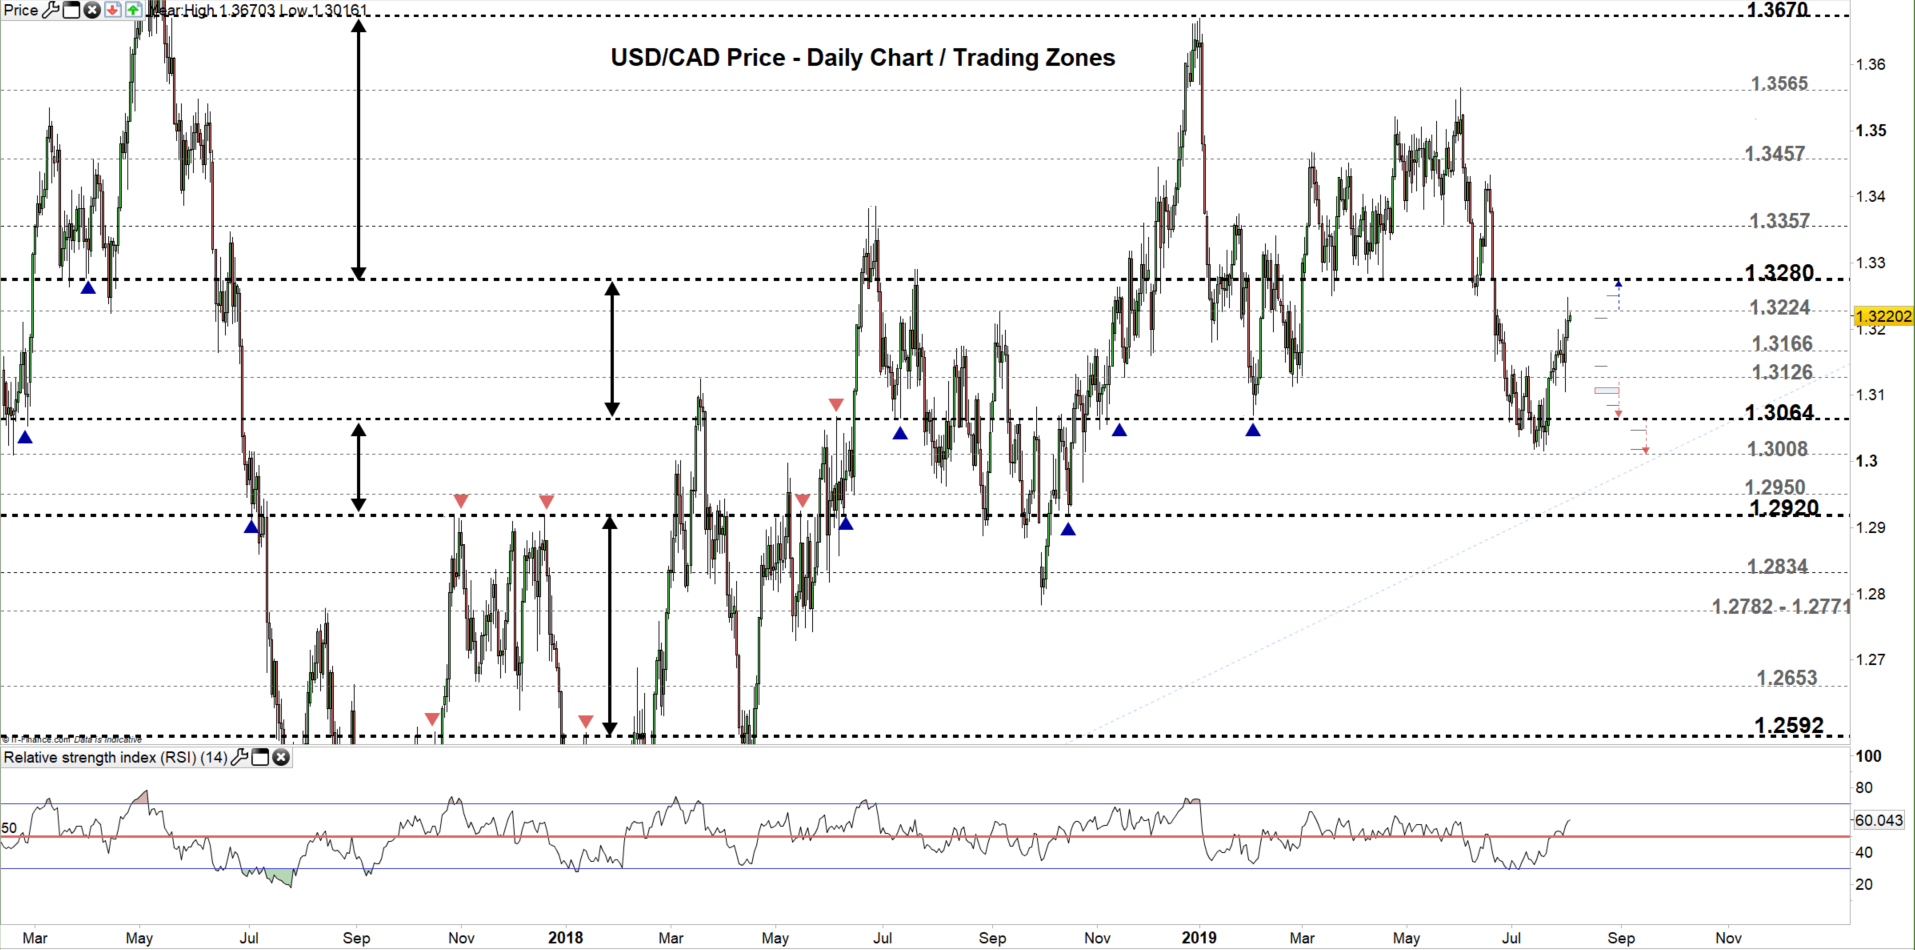
USD/CAD DAILY PRICE CHART (FEB 10, 2017 – AUG 2, 2019) Zoomed Out
USD/CAD DAILY PRICE CHART (June 1 – AUG 2, 2019) Zoomed In
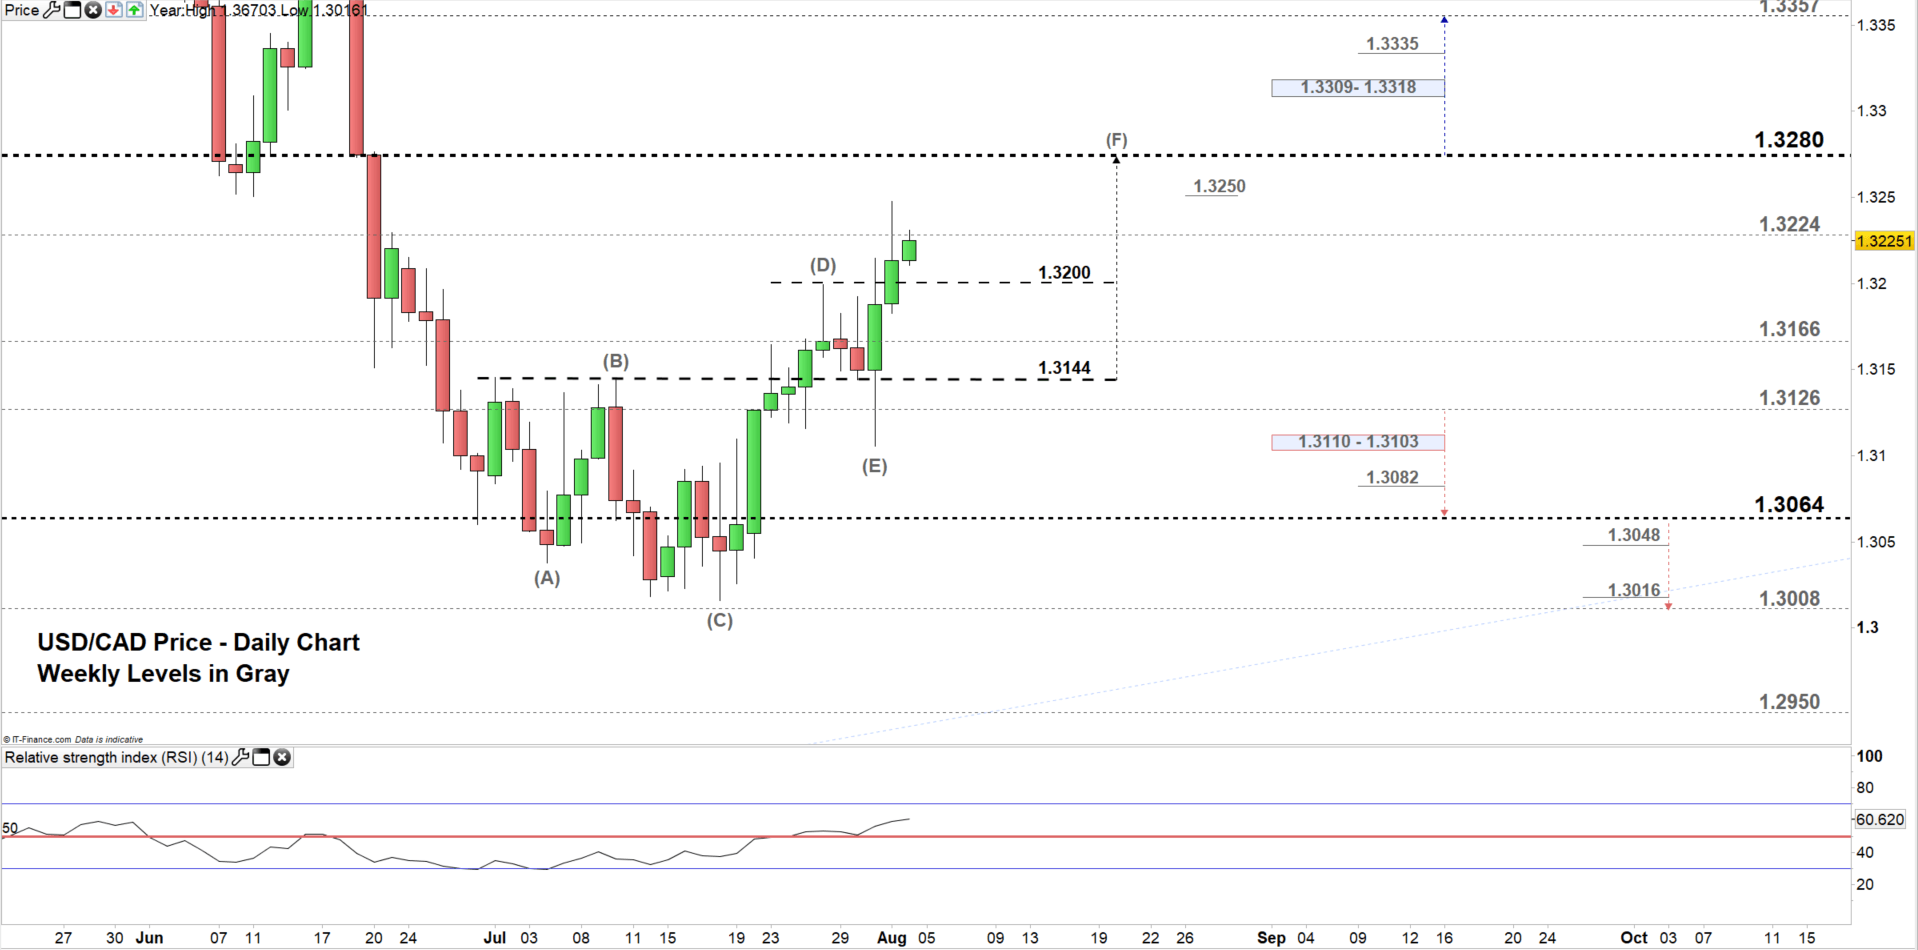
Looking at the daily chart, we notice USD/CAD started to firm above 1.3144 since July 25. The pair tested mentioned level twice this week however, closed above reflecting the buyer’s clear intention to lead the price.
Today, USD/CAD tests a move to the higher trading zone 1.3224 – 1.3280. Hence, a close above the low end could send the price towards the high end in the next week. Although, the weekly resistance level underlined on the chart (zoomed in) should be kept in focus. Further close above the high end may cause a rally towards 1.3357. Nonetheless, the weekly resistance level and zone marked on the chart should be considered.
On the other hand, any failure in closing above the low end could send the pair towards 1.3166 contingent on clearing the handle drawn on the chart (zoomed in). See the chart to know more about the lower trading zone/s with the daily and weekly support levels the price might rebound from in a further bearish scenario.
Just getting started? See our Beginners’ Guide for FX traders
USD/CAD Four-HOUR PRICE CHART (JUly 15 – AUg 2, 2019)
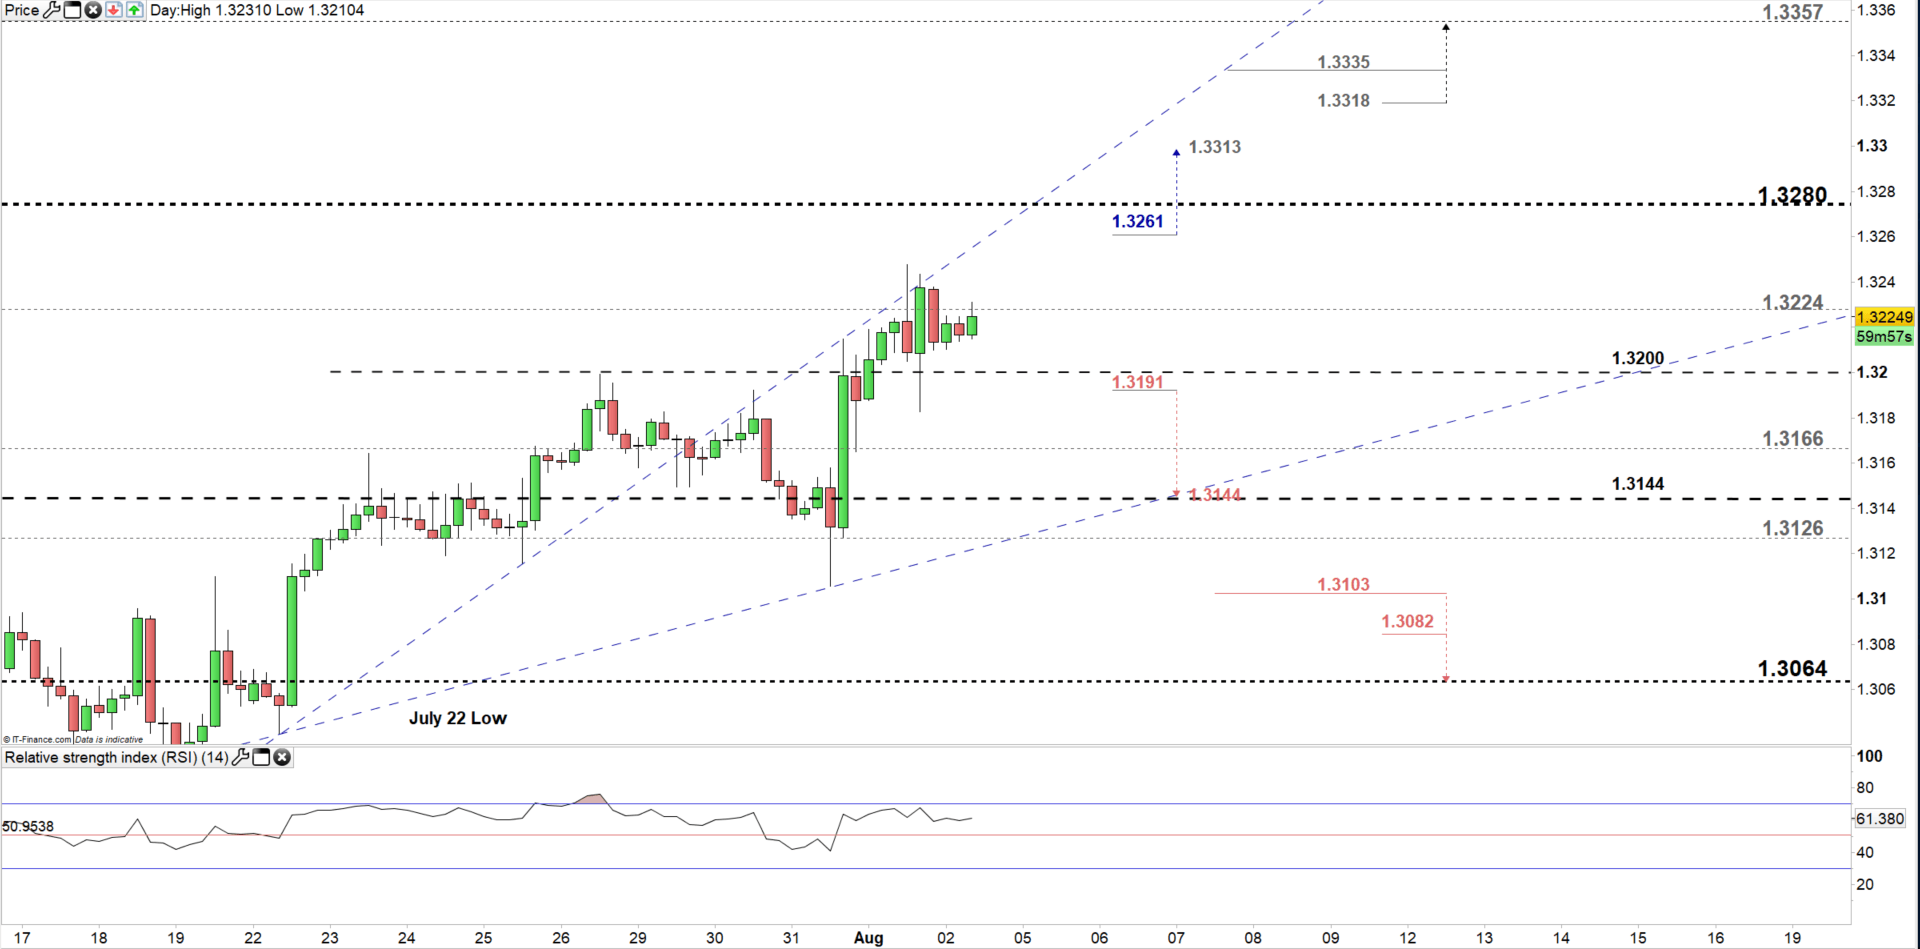
Looking at the four-hour chart, we notice on Wednesday USD/CAD climbed above 1.3200 handle for the first time in five weeks. Although, the buyers need to clear the high uptrend line on the trend lines fan originated from the July 22 low at 1.3040 in order to rally the price.
Therefore, a break above 1.3261 may push the price towards 1.3313. However, the high end of current trading zone needs to be kept in focus. See the chart to know more about the next resistance level buyers would encounter above mentioned levels.
On the flipside, a break below 1.3191 could send the price towards 1.3144 for a test of the low uptrend line on the trend lines fan originated from the low mentioned above. Although, the daily support level at 1.3166 should be watched closely. Look at the chart to know the next support levels sellers would face below the uptrend line.
Written By: Mahmoud Alkudsi
Please feel free to contact me on Twitter: @Malkudsi


