


USD/CAD Price Outlook
Have you checked the Q3 USD and Gold forecasts download for free main currencies and commodities trading guides.
USD/CAD – Hesitant Buyers
On Friday,USD/CAD rallied and rebounded nearby the 1.3200 handle, printing its highest level in over four weeks. However, the price slipped back then closed with a bearish Doji pattern, indicating to a possible reversal move.
Last week, the Relative Strength Index (RSI) crossed above 50 however, the oscillator remained flat this week, reflecting the buyer’s loss of momentum.
Having trouble with your trading strategy? Here’s the #1 Mistake That Traders Make
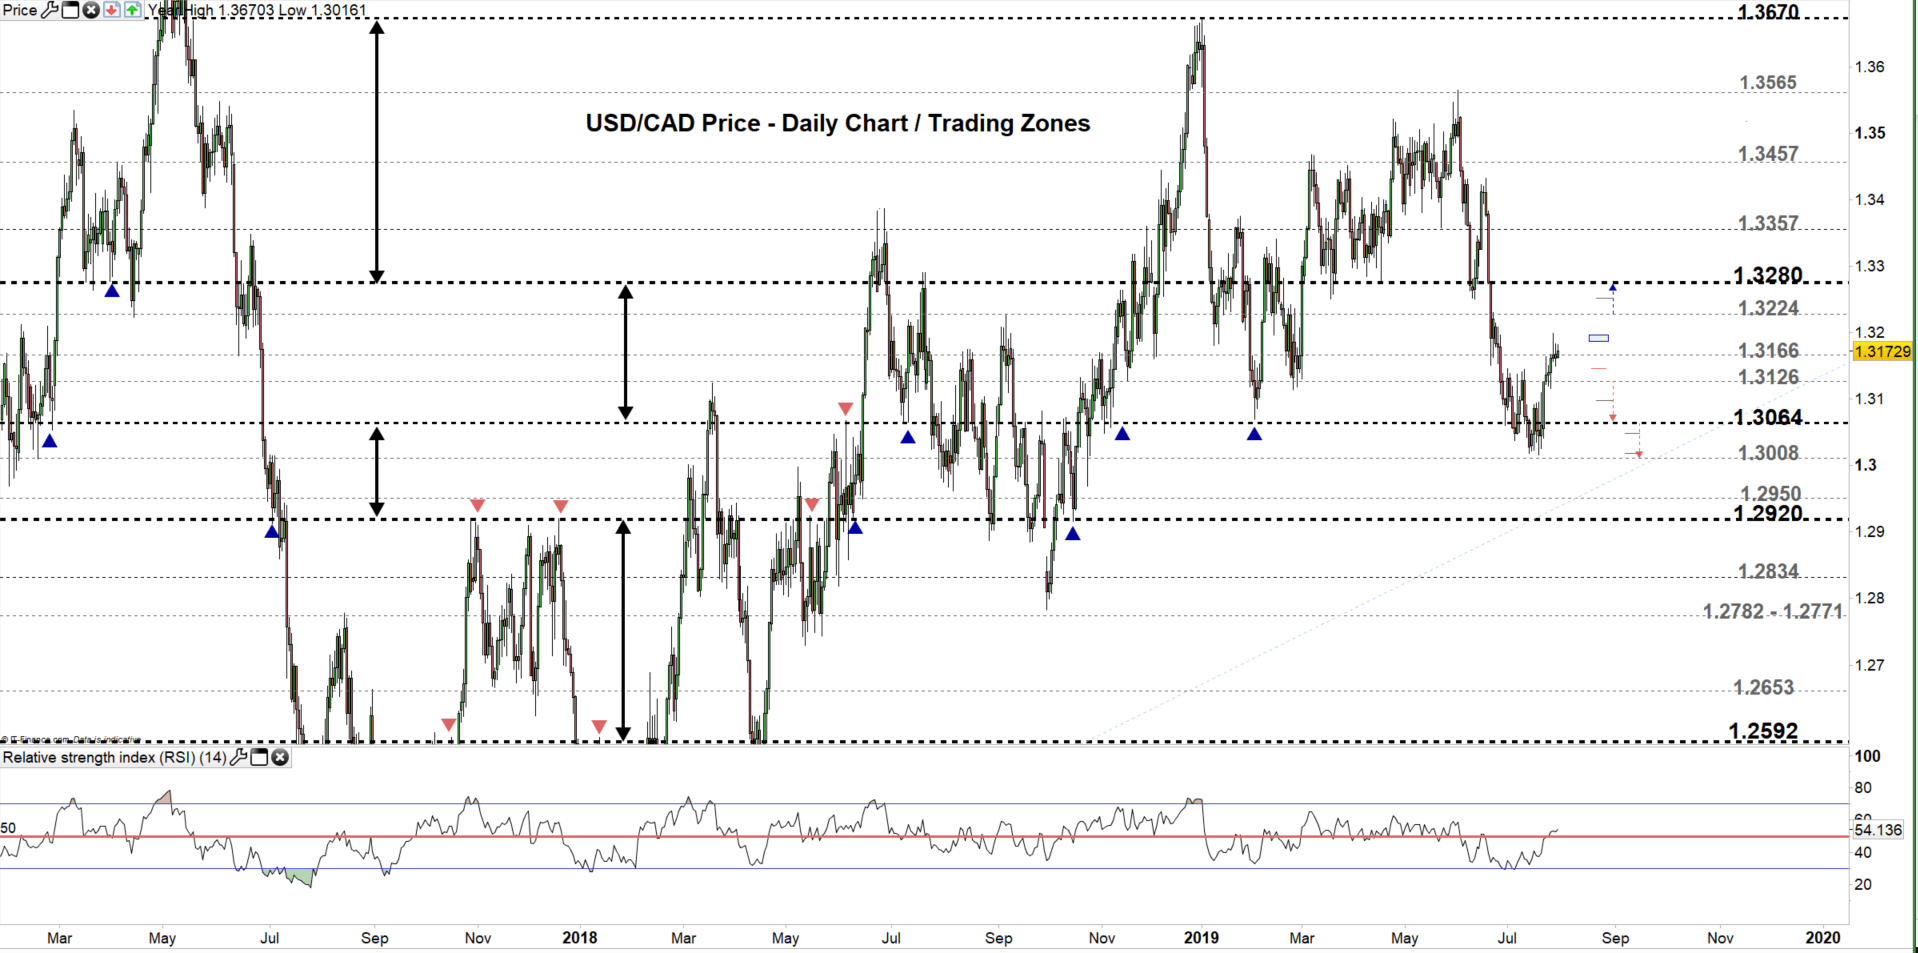
USD/CAD DAILY PRICE CHART (FEB 1, 2017 – July 30, 2019) Zoomed Out
USD/CAD DAILY PRICE CHART (June 7 – JULY 30, 2019) Zoomed In
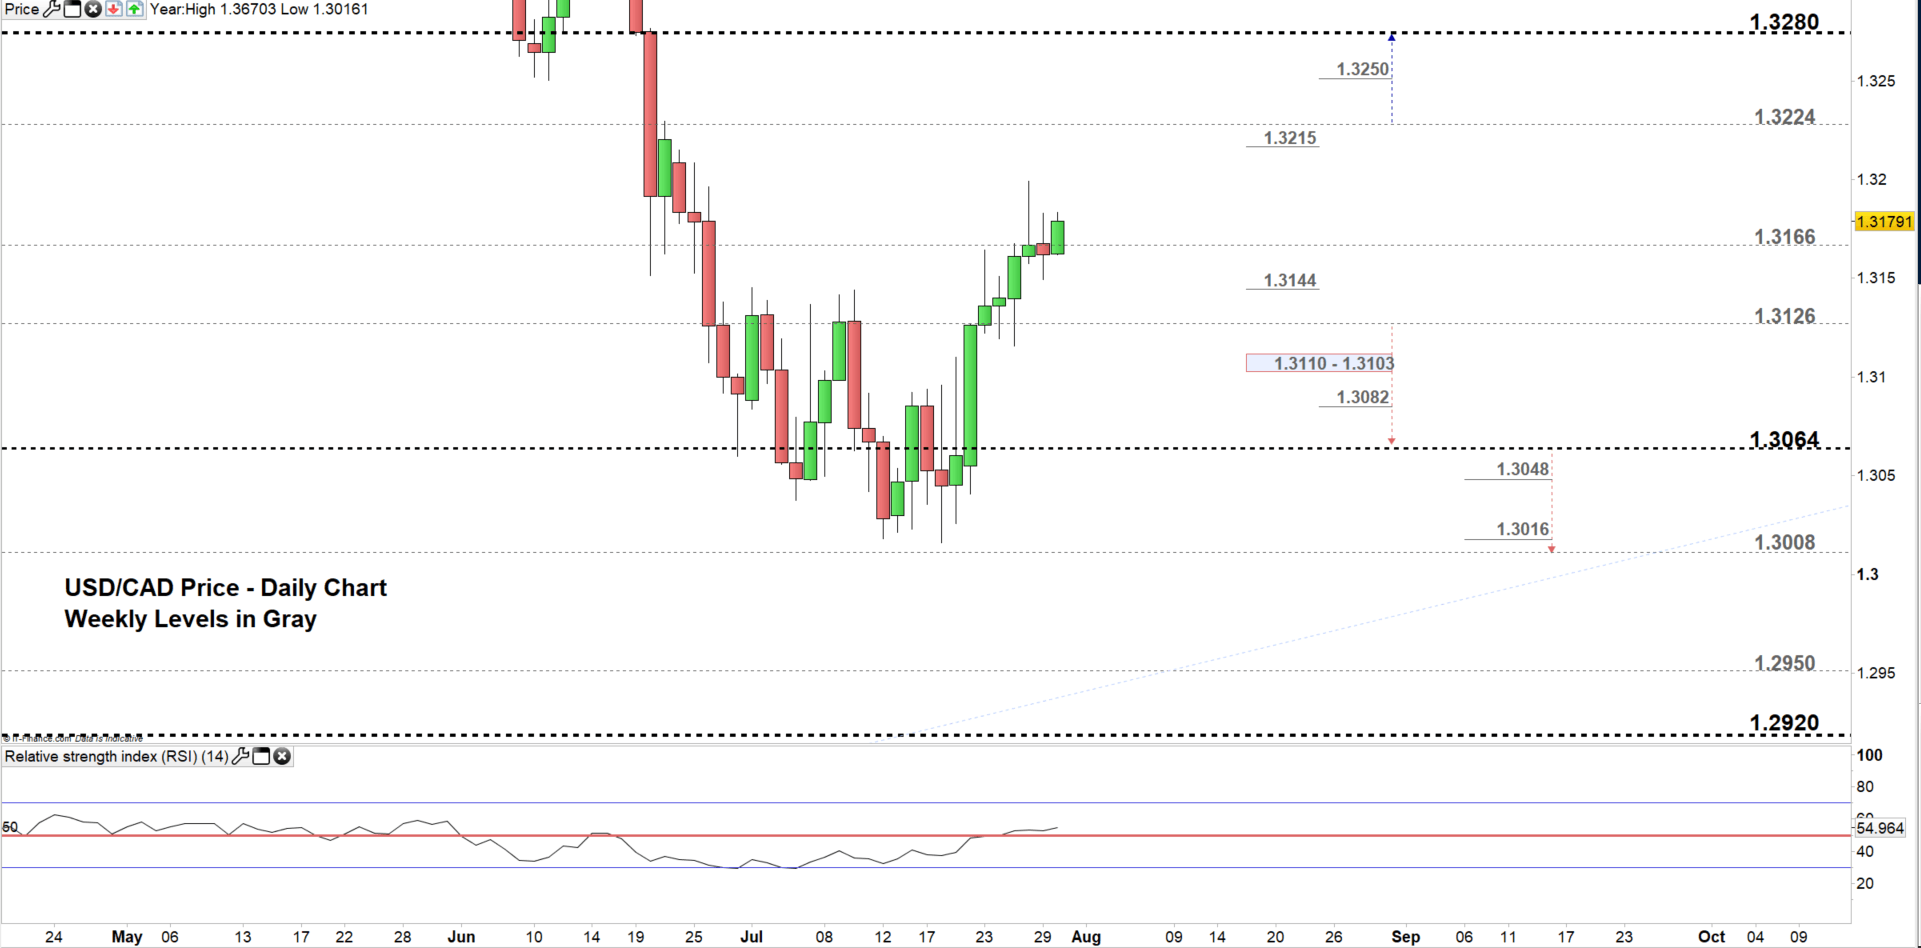
Looking at the daily chart, we notice on Friday USDCAD failed to close above the low end of current trading zone 1.3166 – 1.3224. Yesterday, the price repeated its failure to close above the low-end emphasizing buyer’s weakness to keep rallying the price.
Hence, another close below the low end today may increase the likelihood of the price falling towards 1.3126. However, the weekly support level marked on the chart needs to be considered. See the chart to know more about the lower trading zone and the weekly support area to watch in a further bearish scenario.
On the flip-side, a close above the low end may lead the price towards the high end. However, the weekly resistance level underlined on the chart needs to be watched closely. See the chart for to know more about the higher trading zone with the weekly resistance level to consider in a further bullish scenario.
Just getting started? See our Beginners’ Guide for FX traders
USD/CAD Four-HOUR PRICE CHART (JUly 18 – JuLY 30, 2019)
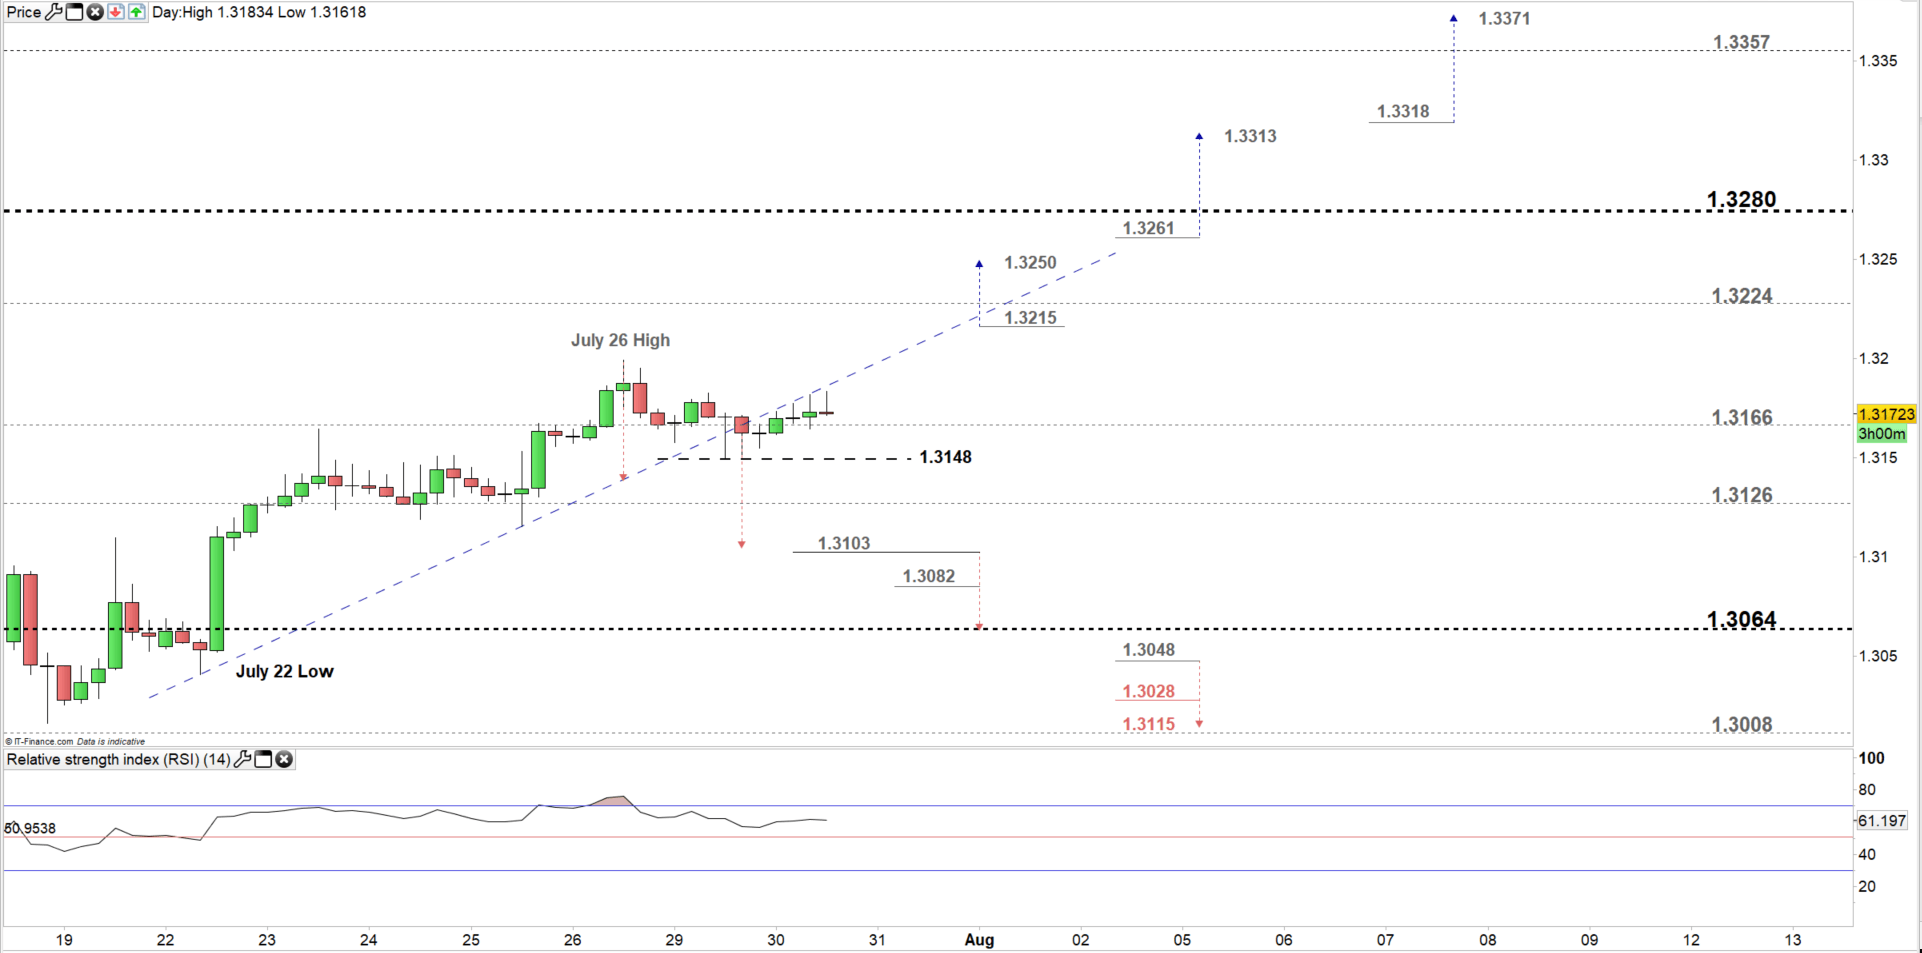
Looking at the four-hour chart, we notice yesterday USD/CAD broke below the uptrend line originated from the July 22 low at 1.3040. Since then, the price has not been able to trade above this line. This suggest the pair may be heading towards 1.3103 contingent on remaining below the uptrend line.
Further bearish move below this level could send the price towards 1.3064. Although, the weekly support underlined on the chart needs to be monitored. See the chart to know more about the key support levels sellers may consider below mentioned levels.
It’s worth noting that, USDCAD could rally above the aforementioned uptrend line however, it may rebound around the July 26 high creating double top pattern where the neckline resides at 1.3148.
Finally, if the pair breaks above 1.3215 this could lead the price towards 1.3250 contingent on clearing the high end of the aforementioned trading zone. See the chart to find out more about the significant resistance levels if the rally continues above mentioned levels.
Written By: Mahmoud Alkudsi
Please feel free to contact me on Twitter: @Malkudsi


