


USD/CAD Price Forecast, Charts and Analysis
Did you check our US Dollar and Gold latest forecasts? Find out more for free from Q3 main Currencies and Commodities forecasts
USD/CAD – Bearish Move with Lower Momentum
On July 3, USD/CAD tested the vicinity discussed in our previous update at 1.3064-60, then broke below yesterday printing its lowest level in nearly eight and a half months, however; the price closed with a Doji pattern indicating to the market’s indecision .
Alongside, the Relative Strength Index (RSI) tested the oversold territory and remained flat in the last two days, indicating to the continuation of the downtrend yet with less impulse.
Having trouble with your trading strategy? Here’s the #1 Mistake That Traders Make
USD/CAD DAILY PRICE CHART (July 19, 2017 – July 05, 2019) Zoomed Out

USD/CAD DAILY PRICE CHART (April 2 – JULy 5, 2019) Zoomed In
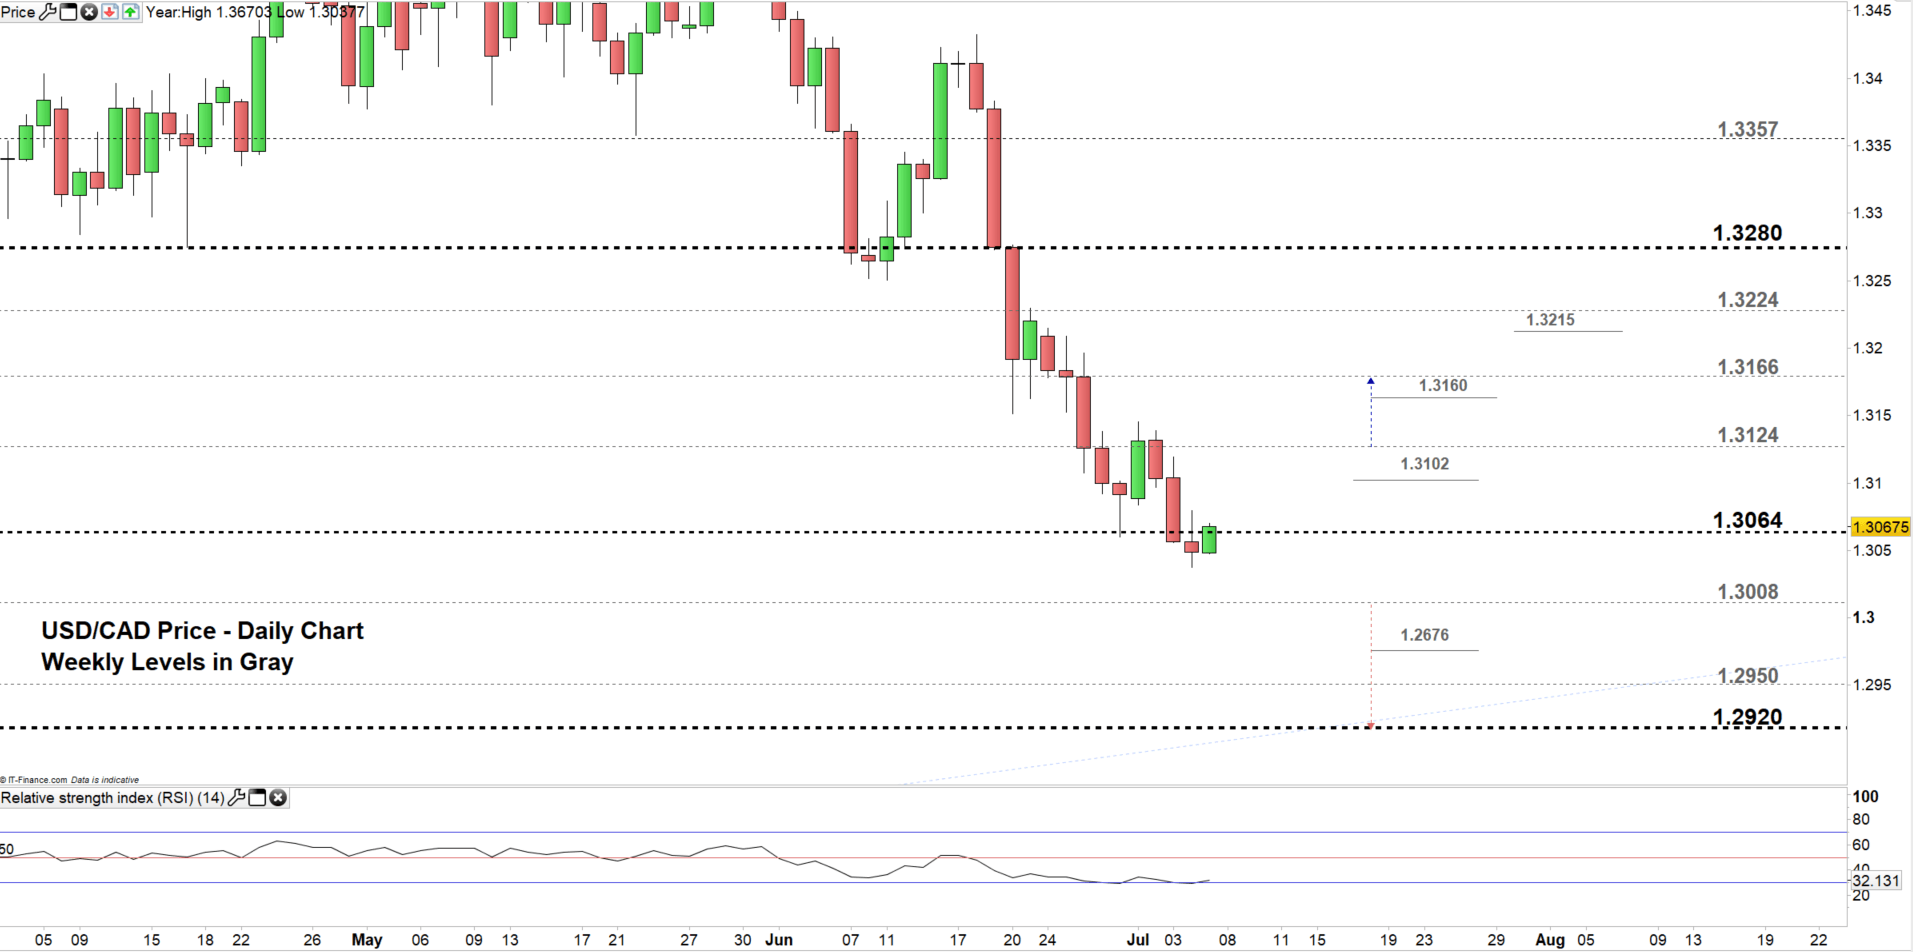
Looking at the daily chart we notice USD/CAD yesterday closed for the second day in a raw in the trading zone 1.3064 -1.3008, therefore; the pair may fall towards the low end of the zone.
Further close below the low end could send the price even lower towards 1.2920, however; the weekly support levels marked on the chart need to be watched along the way.
On the flip-side, any close above the high end of the aforementioned trading zone may cause a rally towards 1.3124, although; the daily resistance at 1.3102 needs to be watched closely. See the chart for more key levels if the pair closes above 1.3124.
Just getting started? See our Beginners’ Guide for FX traders
USD/CAD Four-HOUR PRICE CHART (June 17 – JuL 5, 2019)
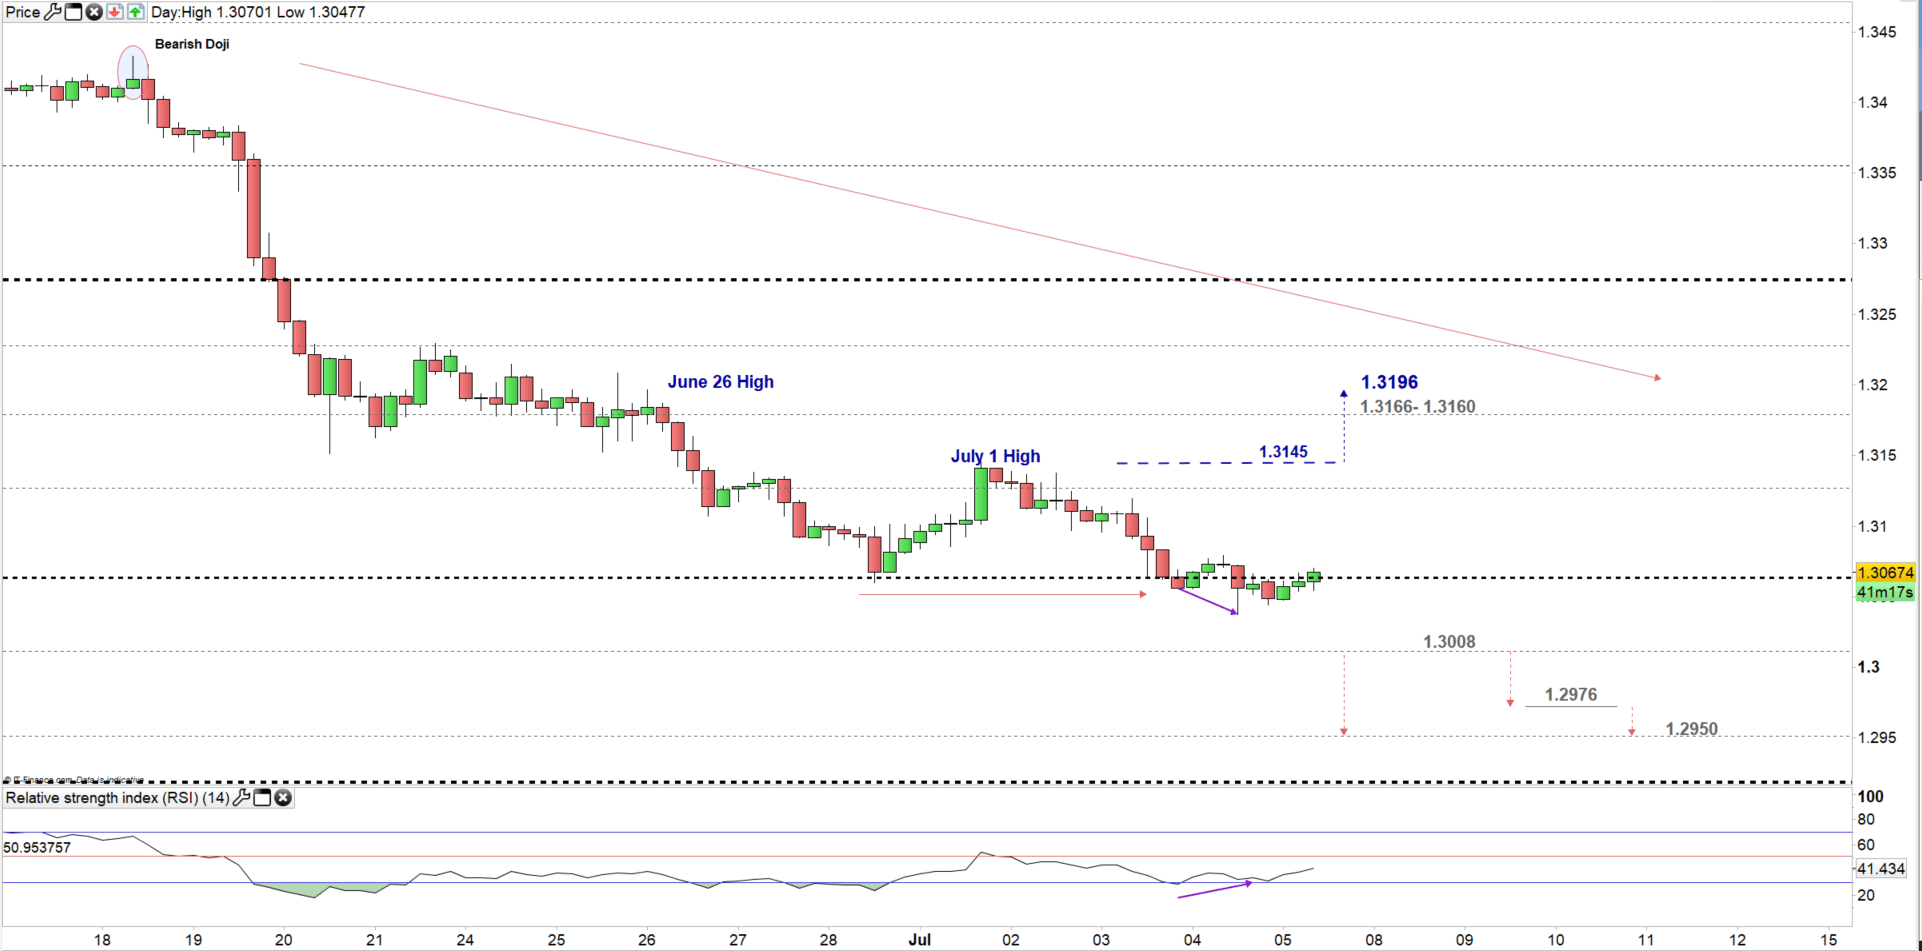
Looking at the four-hour chart, we notice on June 18 USD/CAD started a downtrend creating lower lows with lower highs, however; with less momentum since July 1. On Wednesday, the downtrend resumed creating lower lows, nonetheless; we notice a positive divergence between the price and (RSI) indicates to a possible upside move.
On July 1 USD/CAD peaked at 1.3145, therefore; a break above this level (the weekly high) might send the price towards the June 26 high at 1.3196, however; the weekly resistance zone marked on the chart needs to be considered.
On the other hand, any break below 1.3008 may press the price towards 1.2950, although; the weekly support level underlined on the chart should be kept in focus.
Written By: Mahmoud Alkudsi
Please feel free to contact me on Twitter: @Malkudsi


