


USD/CAD Technical Analysis
- Important Data for CAD Due Next Week, Including CPI.
- USD/CAD Correcting Its Upward Trend Hinting a Movement Towards the Downside
See the Q2 USD and CAD forecast and check what is likely to drive price action through mid-year.
See the DailyFX Economic Calendar for a comprehensive look at all next week’s data releases.
Having trouble with your trading strategy? Here’s the #1 mistake that traders make
USD/CAD Daily Price Chart (Nov 2018 – May 10, 2019)
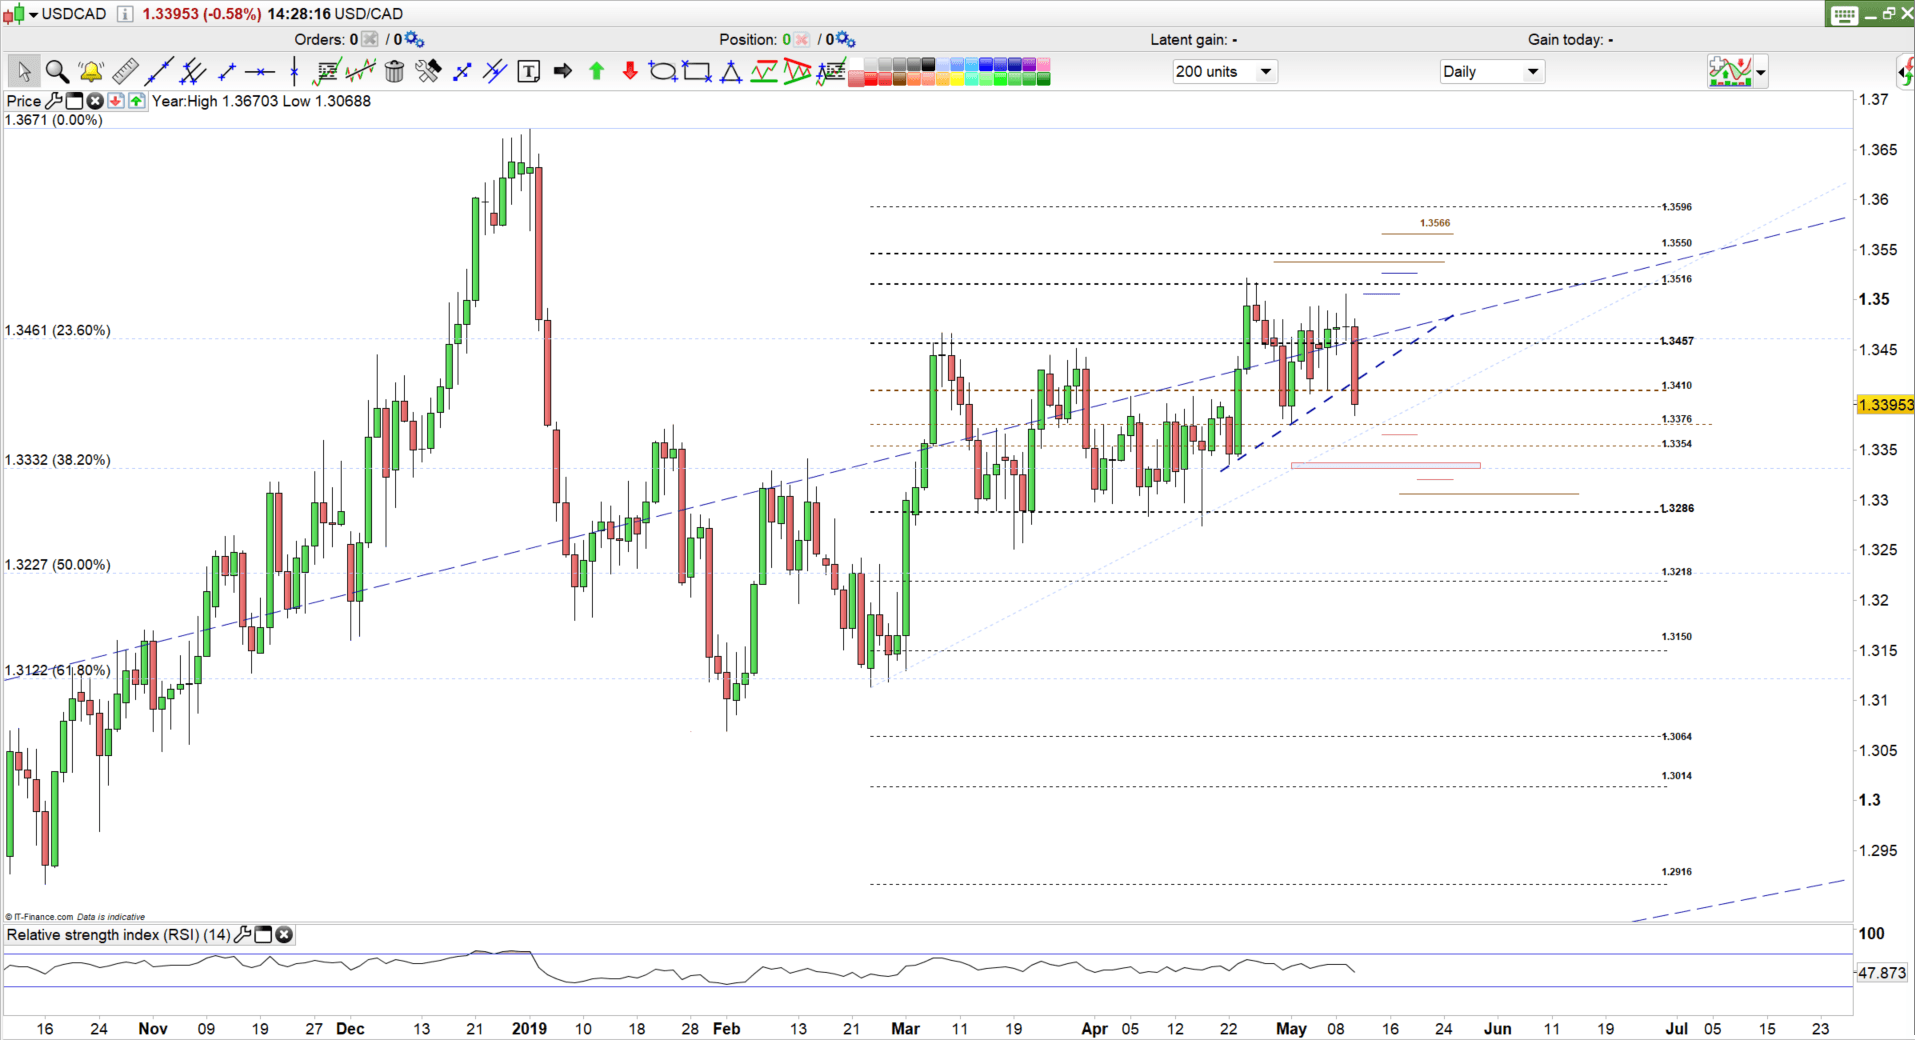
From Bullish to Bearish
In the second half of April, USD/CAD had been trading to the upside from the higher-high created on April 24 at 1.3521 (highest level in nearly 4 months), to the May 1 lower-low at 1.3377. On May 6^th^, the pair corrected its movement and carved out a lower-high at 1.3494 before closing below 1.3457. In turn, this saw the pair decline towards the levels highlighted in last week's article: USD/CAD Price Outlook - Looking for a break below 1.3410 ?
Wednesday's price action saw USD/CAD close above 1.3457 before rallying towards 1.3516 the following day. The pair failed at 1.3505 which resulted in a bearish Doji pattern. Alongside this development it is worth noting that the Relative Strength Indicator (RSI) has stagnated since the start of this week between (53.5 - 57.5).
To Sum up: A close below 1.3410 today would be a negative development suggesting a push towards 1.3376. If support in the vicinity of 1.3384-76 is broken a stronger bearish outlook could push USD/CAD towards the zone between 1.3337 and the 38.2 % Fibonacci retracement at 1.3322; contingent on first clearing additional support levels at 1.3365, 1.3354, 13342.
What if USD/CAD closed above 1.3410 this week?
This would keep the price within the same trading range, suggesting the pair might push towards the higher side of the range at 1.3457, however; resistance levels at 1.3425 and 1.3444 are worth monitoring. Meanwhile, any close above 1.3457 would take price to the high end of the trading range at 1.3516. However, the resistance levels at 1.3494 and 1.3506 need to be watched along the way.
USD/CAD 2 Hours Price Chart (May10, 2019)
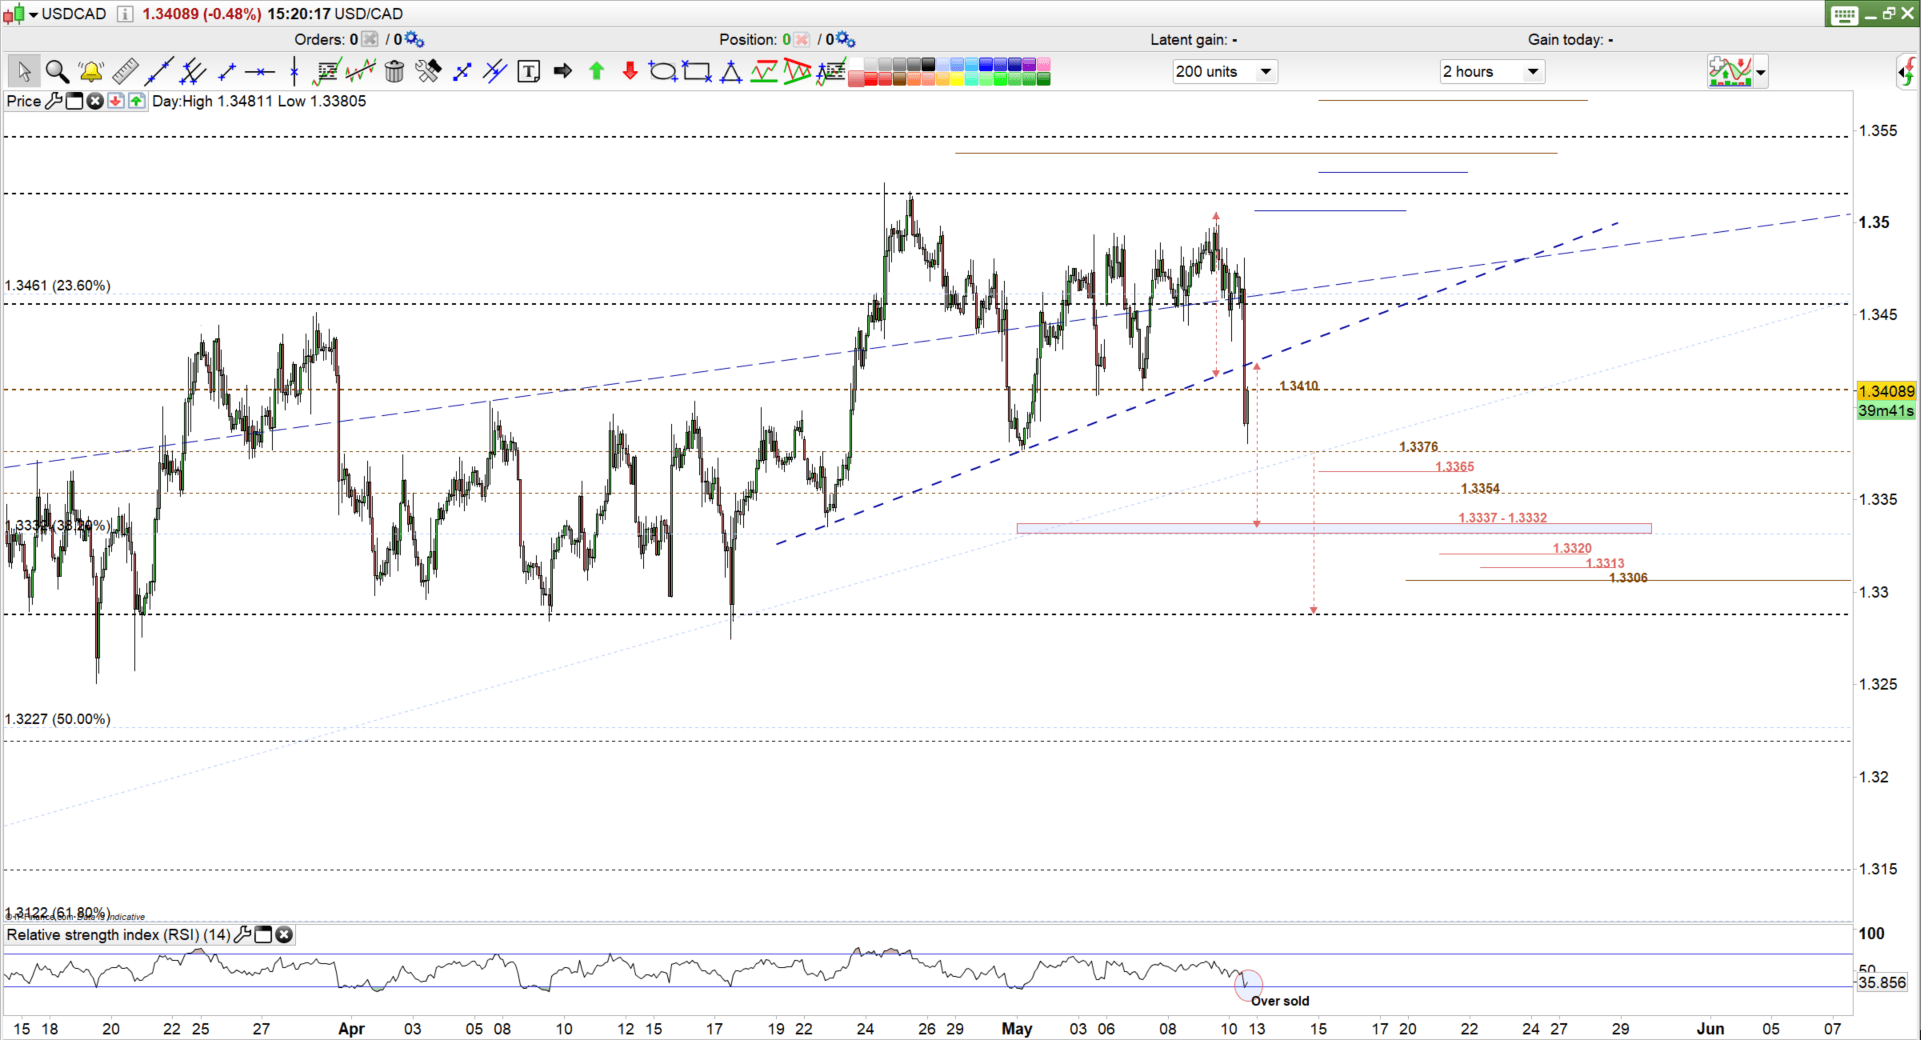
Bearish Development
USD/CAD has fallen 0.7% throughout the session due to the positive Canadian data release, breaking below 1.3422 where the rising trend-line originated off of the April 22 Low. If the price remains below it could push towards the zone of 1.3337 - 1.3332, taking into consideration the support levels mentioned above.
Meanwhile, the Relative Strength Indicator (RSI) has fallen sharply from 47.7 to 31 today, emphasizing the strength of bearish momentum as RSI edges towards a an oversold reading.
Written By: Mahmoud Alkudsi
Please feel free to contact me on Twitter: @Malkudsi
Just getting started? See our beginners’ guide for FX traders


