


Canadian Dollar Rate Forecast Key Takeaways:
- The ONE Thing: If you thought the Brent & WTI breakdowns in price were bad, check out Canadian Select. Western Canada Select Crude from Alberta fell from summer high of $79 to trading near $13/bbl this month, which hurts A LOT the terms of trade in Canada. Canada announced production cuts to support the market in the same spirit as OPEC, but long-term
- Weakening terms of trade will likely make it difficult for the Bank of Canada to remain hawkish or pushing toward two rate hikes in 2019 as is being currently priced. The CAD may be subject to oil volatility that will likely remain elevated into Thursday’s OPEC meeting.
- Technical Outlook: The pair remains favored to move higher as the 55-Day Moving Average (DMA) has crossed above the 100-DMA providing a broader bullish framework. Shorter-term traders may look to price crossing above the 21-DMA to validate bullish trend continuation.
Key Technical Levels for Canadian Dollar Rate to US Dollar:
- Resistance: C$1.3360, November 28 high
- Spot: C$1.3185
- Support: C$1.3079/84, 100-DMA/55-DMA
Canadian Crude Crash Prompts Production Cut, CAD Rallies as Result
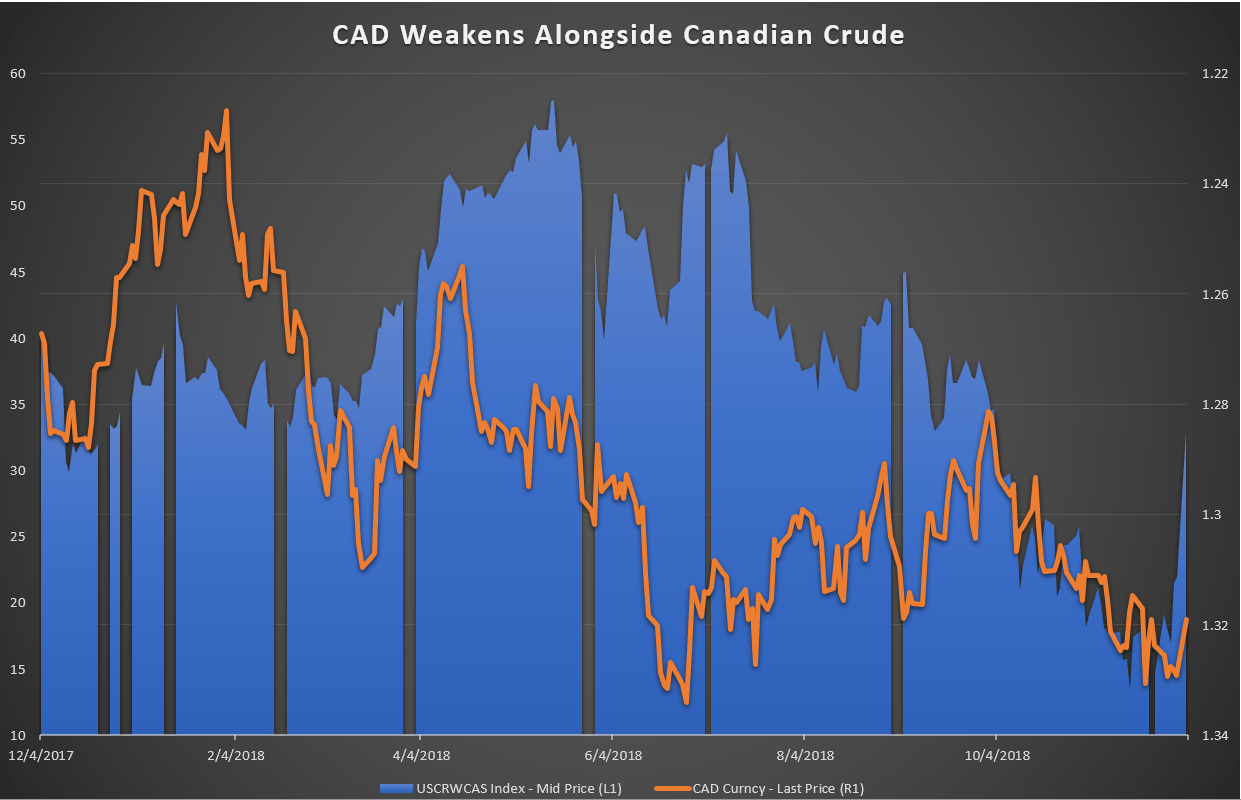
Chart Created by Jake Schoenleb, @SchoenlebFX, Source: Bloomberg
Canadian crude oil is more expensive to refine, and transportation of Canadian crude has sharply cut the price of Western Canadian Select, the benchmark for heavy crude from Alberta’s oil sands. Western Canadian Select recently hit a low of $13.27 a barrel despite a high price of $79 earlier this year.
The 76.7% decline prompted free-market principles to be shelved and OPEC-like production cuts implemented. Historically, the spread between Western Select and WTI has been in the $10-$15 range, but in H2, the spread has blown to nearly $50/bbl.
Much of Canada’s terms of trade, an economic reading of an economies exports values against imported good values, has deteriorated alongside Western Select, which makes bidding up the CAD difficult. Indeed, while the US Dollar has wobbled higher in Q4 global oil markets have likewise broken down with November seeing Oil’s worst month since 2008.
Over the weekend, we learned that Alberta had ordered a production cut in alliance with the OPEC and strategic alliances expected to prop up the market once again. This helped WTI rally by as much as 3%, but the Alberta cut led to Western Select jumping $10/bbl (Remember, the low on November 15 was $13.27/bbl) to $32.91. In other words, while CAD has jumped aggressively against the USD, the 8.7% production cut (~325k bpd) that saw a ~140% or $19 rally translated into a ~1.2% rally in CAD as USDCAD fell from C$1.3360 to C$1.3160 per USD.
The question now becomes both is this move sustainable (please keep laughing to a minimum,) and if not, what will happen to CAD? Looking below, it could be that we are seeing a jump in CAD only to retrace recent weakness that may soon continue.
OPEC Likely To Shake Brent, Which Is Correlated To CAD

Chart Created by Jake Schoenleb, @SchoenlebFX, Source: Bloomberg
Traders may also wish to watch Brent, which is expected to be volatile into Thursday’s OPEC meeting where similar production cuts may be solidified. The correlation to CAD & Brent is near one-year highs, which is unfortunate for CAD bulls as oil recently had the worst month in a decade.
CAD Technical Analysis: Trend Line Break & Moving Averages Support USD/CAD
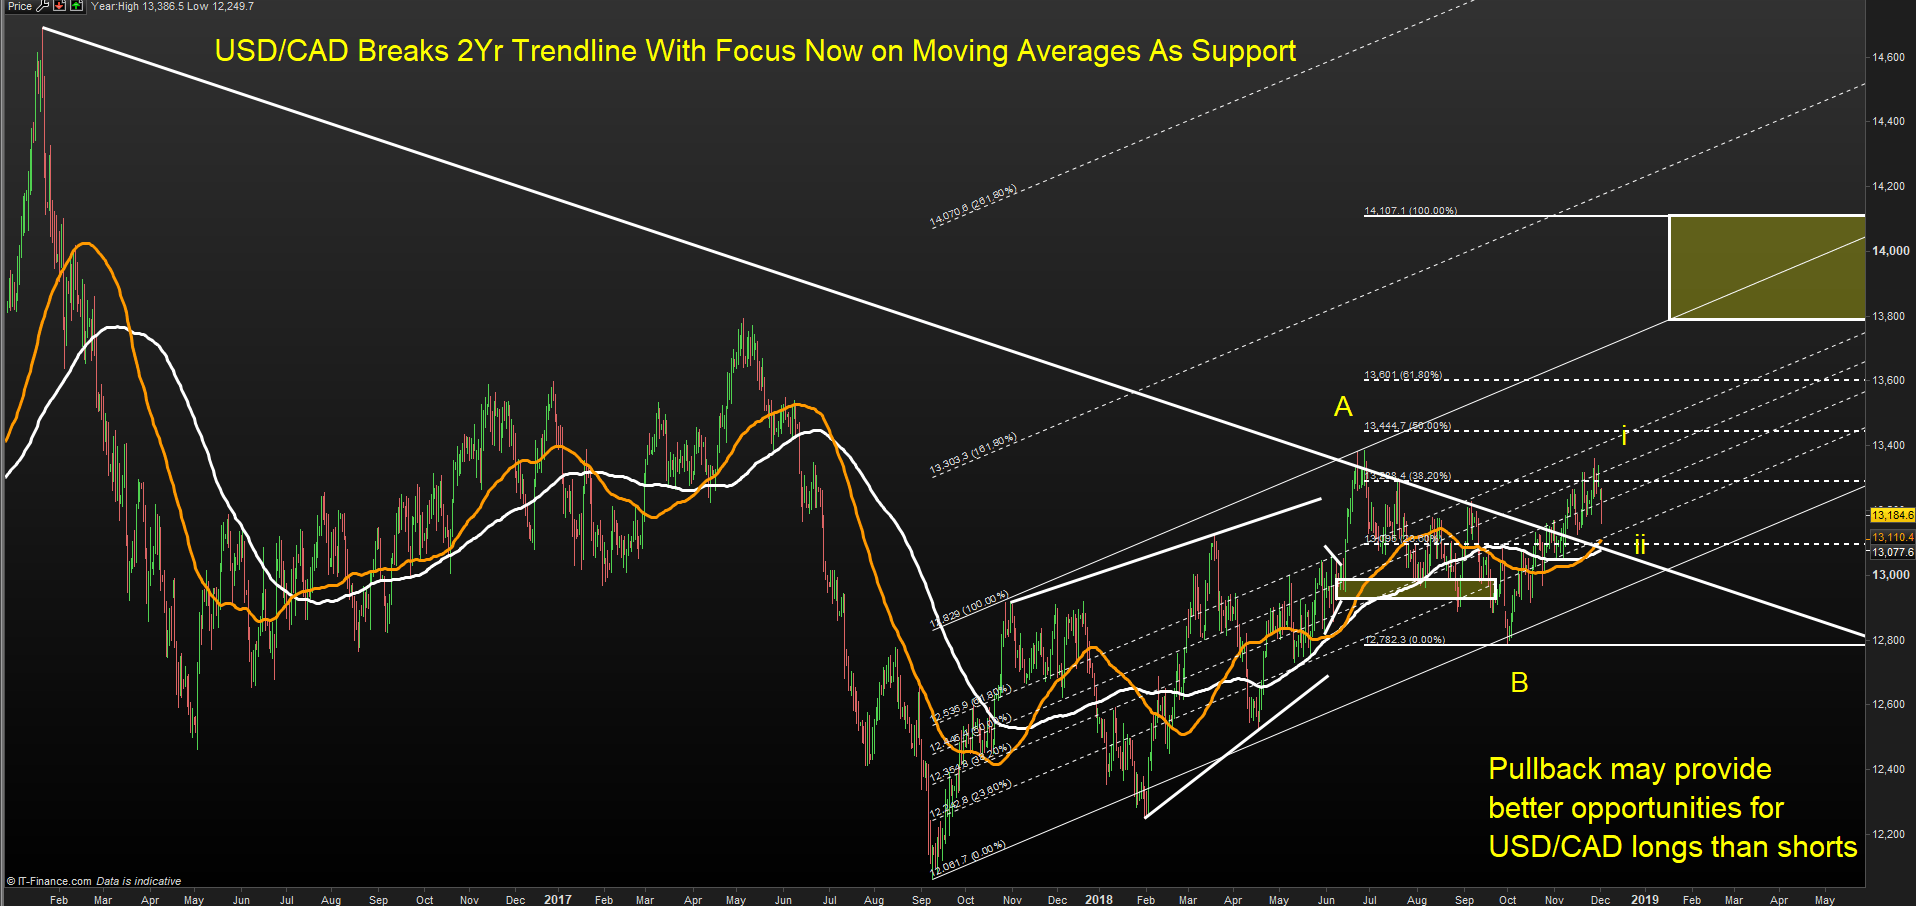
Chart Source: IG Charting Package, IG UK Price Feed. Created by Tyler Yell, CMT
USD/CAD has strongly broken above the multi-year trendline and is not supported by the 55-MA crossing above the 100-DMA. The labeling above shows the recent retracement as a potential pullback in the pair before a larger advance.
Traders should keep an eye on C$1.3385 as that could be a double-top point if the US Dollar runs out of steam or CAD strength re-emerges. A break above C$1.3385 would turn focus toward the May 2017 high of C$1.38, and the 100% Fibonacci expansion from the base of ‘B’ to C$1.41 per USD. This view will remain in favor with weekly closes above C$1.30, which is the 61.8% retracement point of C$1.3385-C$1.2782.
A break below C$1.2782 would turn the focus toward a possible double top, and likely put traders on the sidelines until clarity formed.
Leveraged Funds Added CAD Short Positions, Though Not Aggressively
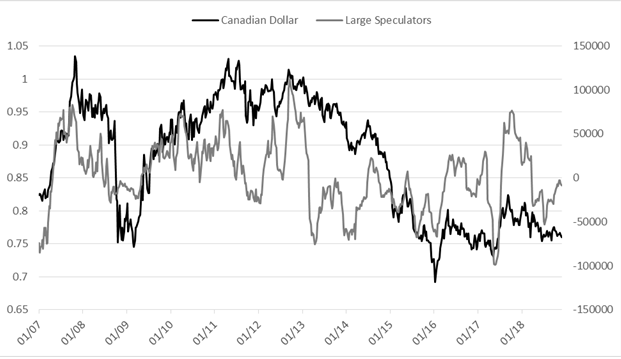
Data source: Weekly CoT Update for Gold, GBP/USD, and Other Major Markets
The chart above from Paul Robinson’s Commitment of Traders index, one of my favorite indicators and a podcast session dedicated to the indicator can be found here, shows short positions in CAD have been a dominant trend in 2018 among leveraged funds.
The Commitment of Traders (CoT) is worthwhile reading for any shorter- or medium-term trader as it is seen as a one-stop shop to see how much of key assets are being bought or sold on any given week by both hedge funds and commercial institutions, and in today’s case, on Canadian Dollar futures.
Unless this trend reverses course, which would likely need sustainable support from other indicators, buying CAD at “bargain prices” may still be expensive if the trend of CAD weakness continues.
Forex Trading Resources To Support Your Strategy
We hope you enjoy DailyFX’s new podcast: Trading Global Markets Decoded
DailyFX offers a surplus of helpful trading tools, indicators, and resources to help traders. For those looking for trading ideas, our IG Client Sentiment shows the positioning of retail traders with actual live trades and positions.
Our trading guides bring our DailyFX Quarterly Forecasts and our Top Trading Opportunities, and our real-time news feed has intra-day interactions from the DailyFX team. And if you’re looking for real-time analysis, our DailyFX Webinars offer numerous sessions each week in which you can see how and why we’re looking at what we watch.
If you’re looking for educational information, our New to FX guide is there to help new(er) traders while our Traits of Successful Traders research is built to help sharpen the skill set by focusing on risk and trade management.
---Written by Tyler Yell, CMT
Tyler Yell is a Chartered Market Technician. Tyler provides Technical analysis that is powered by fundamental factors on key markets as well as trading educational resources. Read more of Tyler’s Technical reports via his bio page.
Communicate with Tyler and have your shout below by posting in the comments area. Feel free to include your market views as well.
Talk markets on twitter @ForexYell


