


Talking Points:
- USD/CAD Trades Lower on Employment Data
- US NFP (March) Misses Expectations at 98k
- Looking for additional trade ideas for Forex markets? Read our 2017 Market Forecast
The USD/CAD has dropped from weekly highs as US Non-farm Payrolls data for the month of March was released under expectations this morning. Expectations for the event were set at 180k, and released at an actual 98k. This news was coupled with a positive Net Change in Canadian Employment for March. Expectations for this event were set at 5.7k, and released at an actual 19.4k.
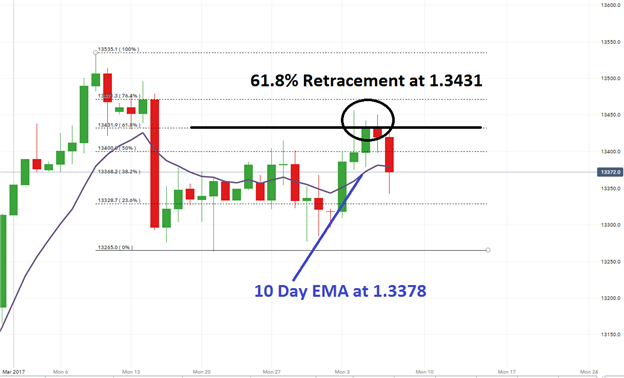
Technically the USD/CAD is again trending lower in the short term, after the pair was rejected at a line of resistance found at a 61.8% Fibonacci retracement value. This line is found at 1.3431 and will remain a point of resistance on the daily chart. With the USD/CAD trading lower today, the pair is now challenging its 10 day EMA (exponential moving average) at 1.3378. A daily close below this point should be seen as significant. If prices continue to decline below this value, traders may begin looking for longer term breakouts next week under the March 21st low of 1.3263.
USD/CAD, Daily Chart with 10 period EMA
Intraday analytics now has the USD/CAD trading below both its S1 and S2 pivots found at 1.3394 and 1.3370 respectively. With both of these lines convincingly broken during today’s news, the next value of support may be found at the S3 pivot at 1.3342. Prices have tested this value once so far today, but have failed to convincingly breakout below this point. In the event of a bearish breakdown in price below this point, traders may next begin to target the round 1.3300 figure, followed by the March 21st low of 1.3263.
In the event that the USD/CAD remains supported above 1.3342, traders may look for a rebound in price back towards today’s central pivot. For Friday’s trading this line is found at 1.3422. A move above the central pivot should be seen as significant, as the USD/CAD would have retraced all of this morning’s losses at that point. In this bullish scenario traders may find the next point of resistance at the R1 pivot located at 1.3444.
USD/CAD, 30 Minute Chart with Pivots

--- Written by Walker, Analyst for DailyFX.com
To Receive Walkers’ analysis directly via email, please SIGN UP HERE
See Walker’s most recent articles at his Bio Page.
Contact and Follow Walker on Twitter @WEnglandFX.


