


Talking Points:
- USD/CAD Technical Strategy: trading sideways, looking for 100-DMA (1.3298) support
- US & Canadian employment look for wage growth in the US and positive trend in Canada
- If you’re looking for Q2 Financial Market Forecasts, you can get them here
USD/CAD has drifted higher over 2017 as oil has global investors worried about where crude might go. However, crude has seen a decelerating selling trend per CFTC positioning data as OPEC is gaining the market’s hope that they will extend production cuts past the original June deadline. The positive correlation of oil to the Canadian Dollar has many traders consistently looking to Oil to see where the Loonie may trade next.
This week, traders may take their eyes off crude in favor of Friday’s jobs report that display recent hiring trends in both economies. Next week, the BoC is meeting, and a positive jobs report could earn their respect causing hawkish tones to find its way through Poloz’s message despite him providing no new guidance last week. Recently, we have seen Canadian data, specifically jobs, gaining at a stable pace since August and further gains could encourage CAD buyers in the hope that BoC will commend such improvement as a possible reason to normalize policy.
US Jobs data has also been strong, but given the question about reflation that has recently crept into view, many traders are likely to focus on wages. Any disappointing wage data for the US could further exasperate the recent worry and allow the Canadian Dollar to gain despite Oil’s next move.
Interested in Joining Our Analysts, Instructors, or Strategists For a Free Webinar? Register Here
The chart below of USD/CAD shows that we’re trading in the middle of a rising channel. Traders should focus on the support development as the spot price of 1.34 sits above multiple forms of support. Just below the spot price is the trifecta of long-term moving averages, the 50-DMA (1.3239), the 100-DMA (1.3292), and the 200-DMA (1.3200), which all are near the Daily Ichimoku Cloud active as support. The recent drift higher causes a Bullish technical bias to remain absent any of those levels failing to hold.
The resistance that we are watching in this choppy uptrend focuses at first on the March 28 high (1.3114) followed by the March high of (1.35349). A reversal below the multiple levels of proven support near 1.32 would need to break to turn the technical view from bullish to neutral.
What Did The Analysts Learn After Trading Of All 2016? Click Here To Find Out
D1 USD/CAD Chart: Pullback In Rising Price Channel Likely Seen As Opportunity
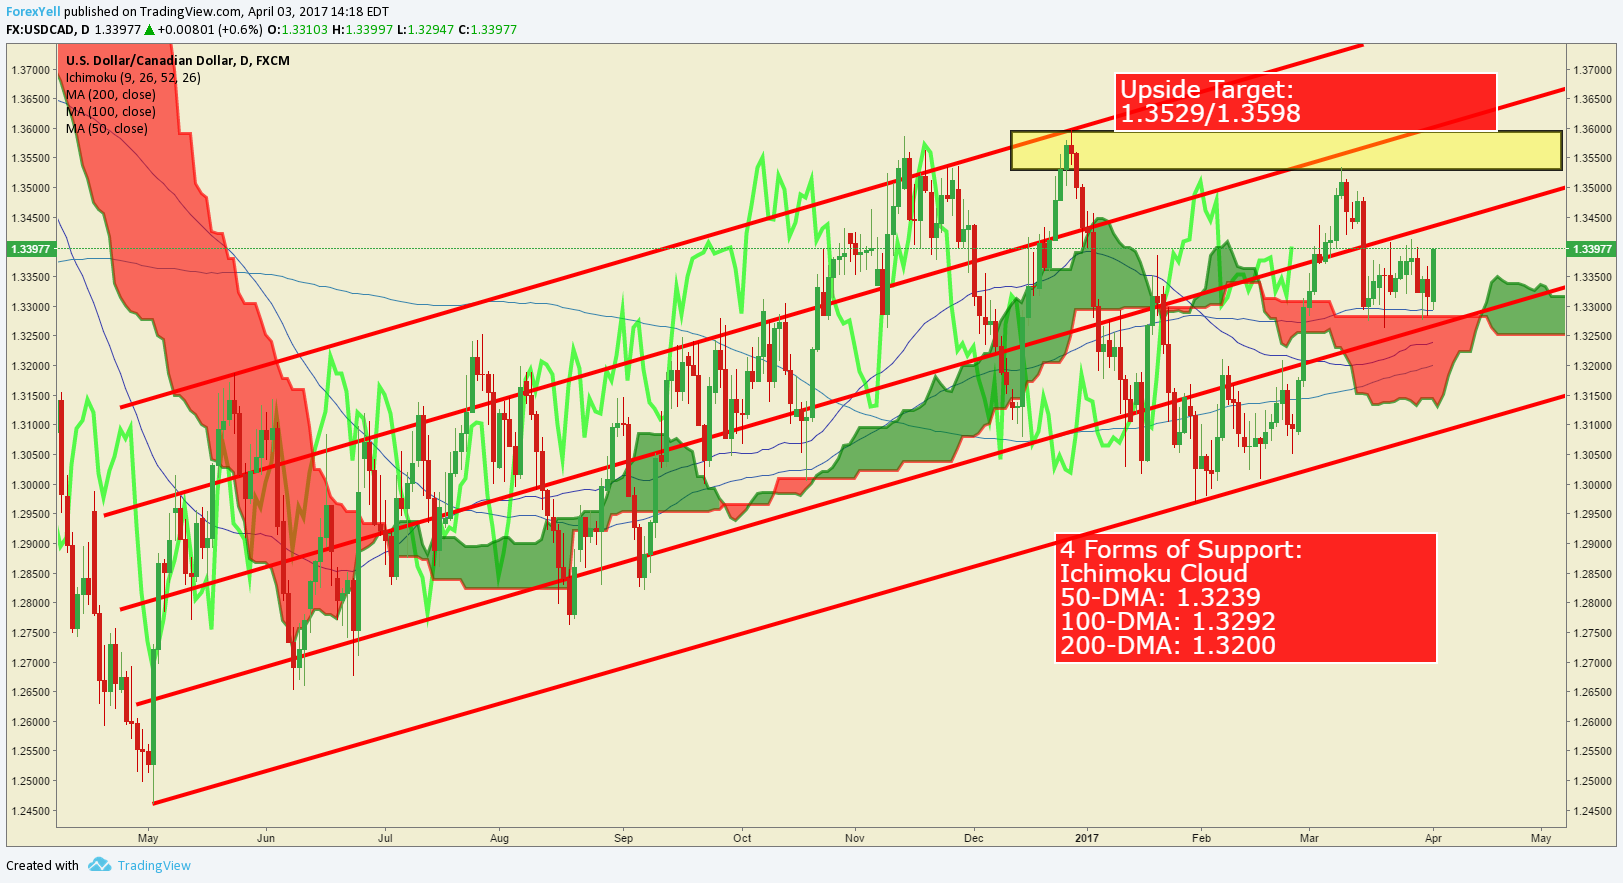
Chart Created by Tyler Yell, CMT
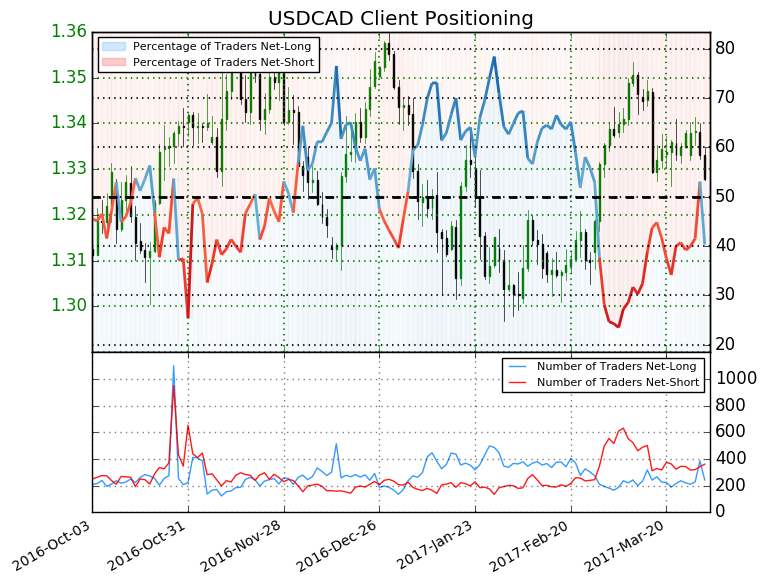
IG Retail trader data shows 40.3% of traders are net-long with the ratio of traders short to long at 1.48 to 1. The number of traders net-long is 4.3% lower than yesterday and 9.5% higher from last week, while the number of traders net-short is 16.5% higher than yesterday and 6.5% higher from last week.
We typically take a contrarian view to crowd sentiment, and the fact traders are net-short suggests USDCAD prices may continue to rise. Positioning is more net-short than yesterday but less net-short from last week. The combination of current sentiment and recent changes gives us a further mixed USDCAD trading bias. (Emphasis Mine)
---
Shorter-Term USD/CAD Technical Levels for Monday, April 3, 2017

For those interested in shorter-term levels of focus than the ones above, these levels signal important potential pivot levels over the next 48-hours of trading.
T.Y.


