


Talking Points:
- USD/CAD Technical Strategy: ST momentum is Bullish, rising in uptrend
- CAD Sinks With Crude Prices on Announcement of Increased Saudi Output During Cut
- Previous Article: USD/CAD Technical Analysis: Overbought RSI May Bring Opportunity
- If you’re looking for trading ideas, unlock our Trading Guides here
The Canadian Dollar is allowing USD/CAD to move higher despite a recent setback in the USD. Much of the focus for CAD weakness has been placed on the upcoming G20 meeting where US Policy is expected to be the main focus and the weakness in Oil. Correlation has picked up between Crude Oil and the Canadian Dollar at the wrong time for CAD Bulls.
Recent reports came out that Saudi had cut back the amount of Crude Oil output they were trimming in part of the accord agreed to last November with OPEC. Given the concern of oversupply relative to demand at the hand of US Shale producers, Oil traders took this as an opportunity to further cut longs with Hedge Funds likely quick to exit the trade as many were long and looked for a move to $60/70 range.
The other issue on the table is how Canada’s major trading partner, the United States will proceed with trade after providing a statement at the G20 Finance Minister in Germany this weekend. Anything statement that hints at protectionism or ‘Buy American, Hire American,’ could carry USD/CAD further still. The focus remains appropriately at the December high (1.3598) and beyond given the structure and momentum of the uptrend.
Interested in Joining Our Analysts, Instructors, or Strategists For a Free Webinar? Register Here
USD/CAD Technical Analysis –The uptrend looks to be firing on all cylinders as USD remains supported ahead of FOMC rate announcement on Wednesday. The sharp rise in the 1.30/31-zone aligned with the May-December range 50% retracement opens up the possibility that we’re in-line to see another rise similar to May-December of ~1137.8 pips or a Fibonacci ratio of that amount fromthe late-January low.
If you look at the current 2017 low of 1.29684 and project the May-December range higher, you will notice that half the range or 568 pips brought us to the high last week of 1.3537, where we’ve since pulled back. However, a continuation higher of 61.8% or 100% expansion of the May-December range from the 2017 low of 1.2968 would open up targets beyond the December high of 1.3598 toward 1.36716 and 1.41062 respectively.
The recently overbought RSI(5) has pulled back, which may open up the opportunity if the trend continues higher for traders looking for longentries. Naturally, the success of the trade will depend on trend continuation.
What Did The Analysts Learn After Trading Of All 2016? Click Here To Find Out
D1 USD/CAD Chart: Continuing to Trade Higher In Bullish Channel
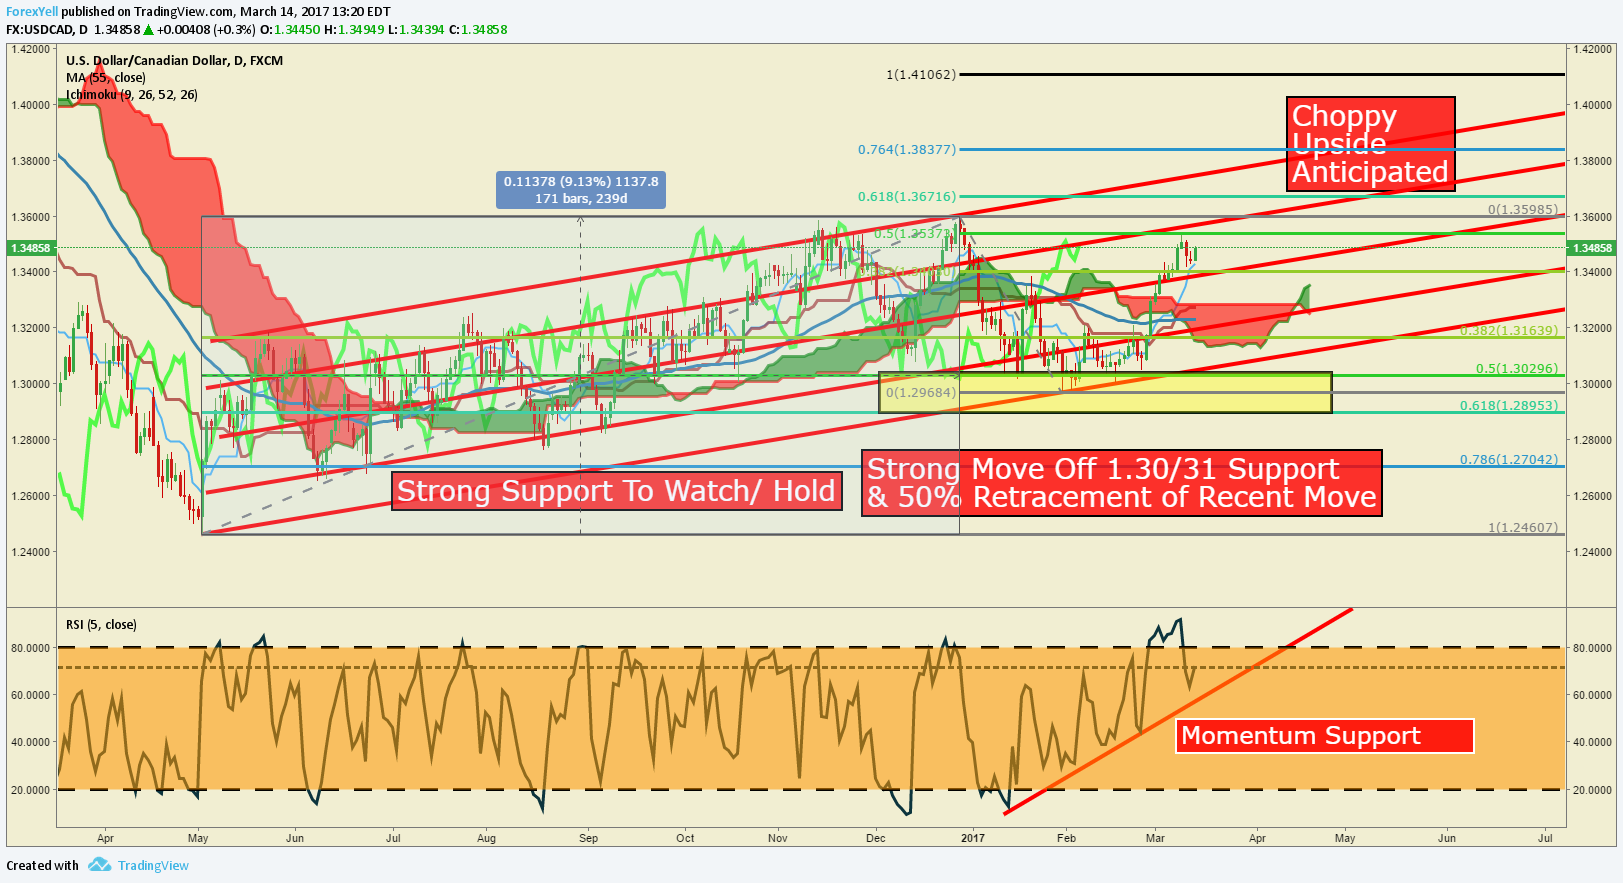
Chart Created by Tyler Yell, CMT
---
Shorter-Term USD/CAD Technical Levels for Tuesday, March 14, 20173

For those interested in shorter-term levels of focus than the ones above, these levels signal important potential pivot levels over the next 48-hours of trading.
T.Y.


