


Talking Points:
- USD/CAD Technical Strategy: Possible leading diagonal could mean aggressive upside still viable
- CAD 2Y Yields Fall ~5% on Trade Deficit As Bank of Canada’s Dovishness May Cause Easing
- Triple Resistance on USD/CAD Near 1.34/35 in focus, but not expected to hold
Quick Fundamental Take:
The Canadian economy remains in search for the benefit of the fiscal stimulus introduced by PM Justin Trudeau. On Friday, we got a mix of Trade and Employment data. The Trade data that initially came out as the widest on record was initially discounted due to a large equipment purchase from South Korean for offshore oil production supplies that showed the data wasn’t as bad as feared. Secondly, the initially impressive employment report ended up showing that all of the gains came from part-time hiring.
Access Our Free Q4 Dollar Outlook As The US Dollar Faces An Unorthodox Presidential Election
In the end, the Bank of Canada could still be on the path toward easing if there remains no pickup in inflation as the current account and trade deficit continue to widen. On October 19, when USD/CAD traded at 1.3005, Poloz downgraded their outlook to the economy and the potential to add more stimulus to return the economy closer to capacity.
Looking For Clear Short-Term USD/CAD Levels Updating In Real-Time? Check Out GSI
The last worthwhile discussion is the U.S. Election, which appears to have tightened leading into the race in a similar fashion to Brexit. The rise in implied volatility could stay elevated after the election, but even if the outcome is seen as U.S. negative, heavy trading partners could be hit even worse like Mexico & Canada, so it’s difficult to walk into the election with a binary view.
Technical Focus:
D1 USDCAD: Watching a Potential 5-Wave Move Higher
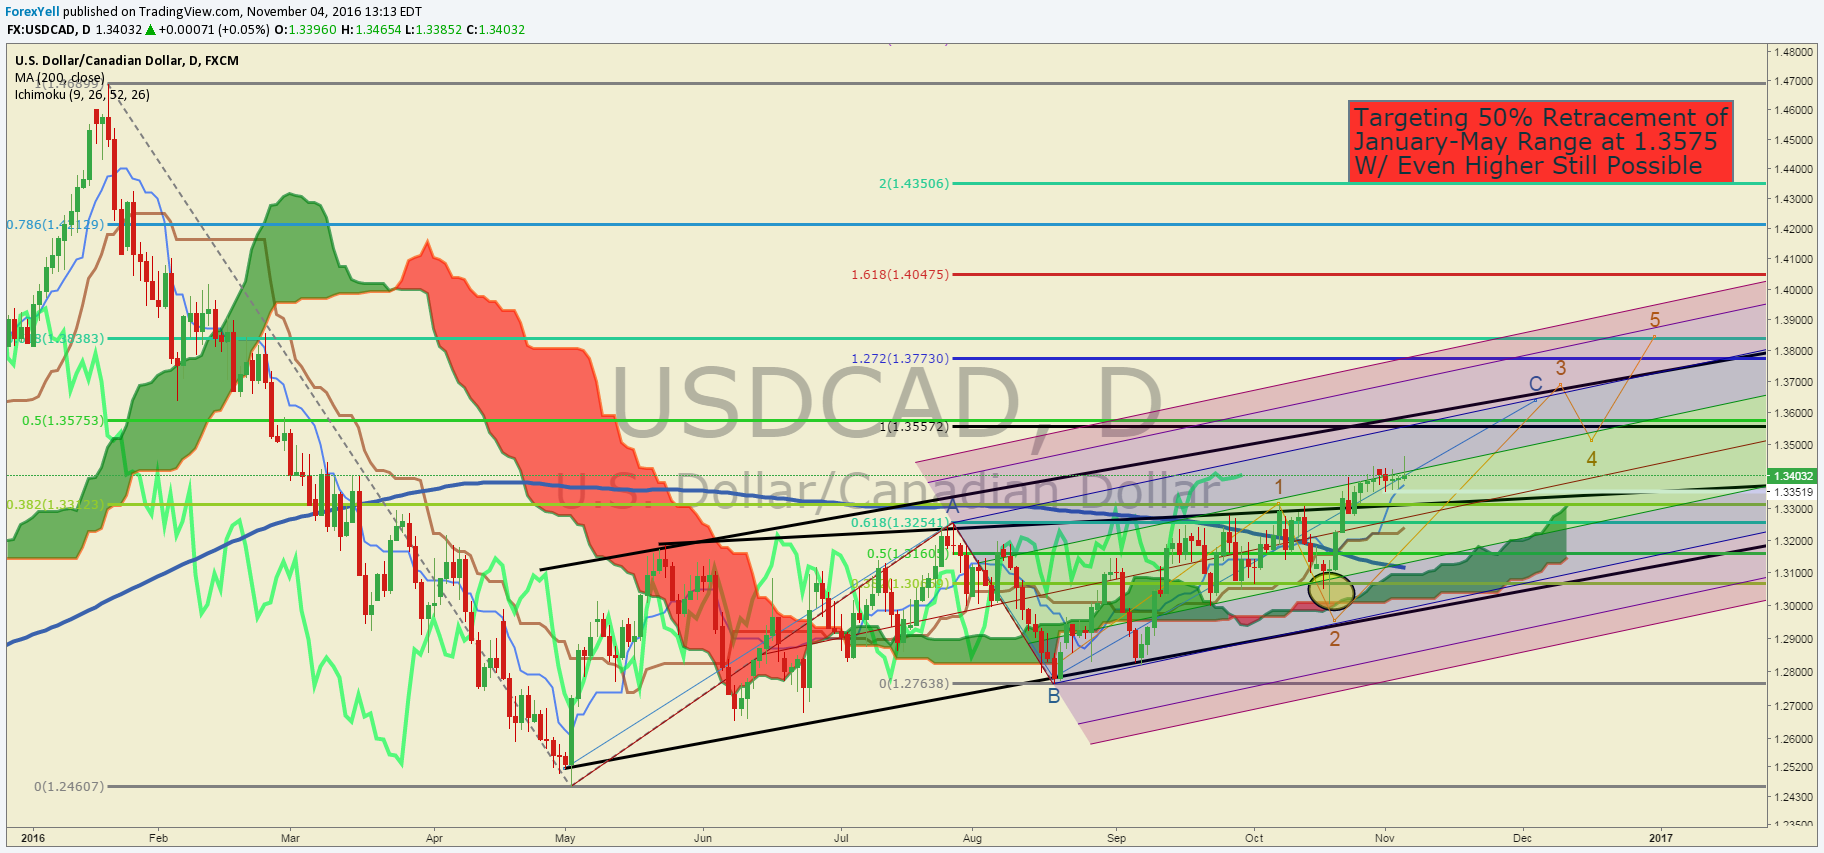
Chart Created by Tyler Yell, CMT
The chart above of USD/CAD looks crowded because, for months, the price action has been confined in the lower 1.30s. On Friday, the price touched an 8-month high of 1.3465. We remain focused on the choppy price action continuing to produce higher highs and higher lows, which is indicative of an uptrend that should not be fought. For traders that are fond of the Ichimoku cloud, the cloud has done a good job of keeping you on right side of impulsive moves.
If price remains above the H4 Ichimoku Cloud, the path of least resistance remains higher, and we could be paving the way for an aggressive rise as we move from a leading diagonal to an impulsive wave ‘iii’ of ‘C’ in Elliott Wave terms. The leading diagonal view is encouraged by the recent break above the pattern high at 1.3313, and the three-wave move toward a 50% retracement of the diagonal down to 1.3005.
In addition to Elliott Wave and Ichimoku, we have added a Modified Schiff Pitchfork. The Modified pitchfork originates the median line from the 50% retracement of price and time of the point of X and A. The Modified Schiff Pitchfork places a helpful frame of price action, which should be watched to see if we can break through price resistance to higher levels.
Interested In Learning the Traits of DailyFX’s Successful Traders? If So, Click Here
Some traders are concerned that we’re seeing a triple top. While there is clear resistance at 1.34/35, we should not get excited about a strong breakdown until we see a break below the zone of support between 1.33/32. Within that zone is the base of the recent drop at 1.32788 that preceded seven-month highs. If the price can hold above that corrective zone, we could be building up for a strong move higher.
Having a Hard Time Trading USD/CAD? This May Be Why
The slope of the rise from 1.3005 on Oct 19 to 1.3465 on Friday likely favors a further advance that could continue on Canadian Dollar underperformance or USD strength. The next upside target is the 50% retracement of the January-May range at 1.3575. 1.35572 is also the 100% Fibonacci Expansion that aligns with an equal wave off the August low that would match the May to July rise. If 1.3575 breaks, we’ll be on the watch of the 61.8% retracement of the same range at 1.3838.
Key Short-Term Levels as of Friday, November 04, 2016

T.Y.


