


Talking Points:
- USD/CAD Technical Strategy: Defensive US Dollar favors eventual breakdown
- Trader Sentiment Warns a move lower could still be in the works, but be careful above ~1.27
- Looking For Clear Short-Term USD/CAD Levels Updating In Real-Time? Check Out GSI
Quick Fundamental Take:
The Bank of Canada was quick to point out financial vulnerabilities that the Canadian Economy is facing while announcing their O/N target rate would remain at 0.5%. There was hope the Canada could avert the trend of lower-growth plaguing much of the world after PM Trudeau's Fiscal Stimulus has failed to translate into consumer spending. The economy is now facing risks of weak inflation and slower economic growth, which the Economic Surprise Index from Citibank has shown a very sharp drop similar to the January move with USD/CAD was moving higher.
Access Our Free Q3 Dollar Outlook As The US Dollar Reserve Status Makes It A Possible Haven
However, the Canadian Dollar is likely a more attractive sell against stronger currencies. As of Wednesday, September 07, 2016, the US Dollar reclaimed the bottom slow on the G8 Strong/Weak Index which measures relative positioning to the 200-MA on an H4 chart.
Strong/Weak Reading As of Mid-Day Wednesday, September 7, 2016:
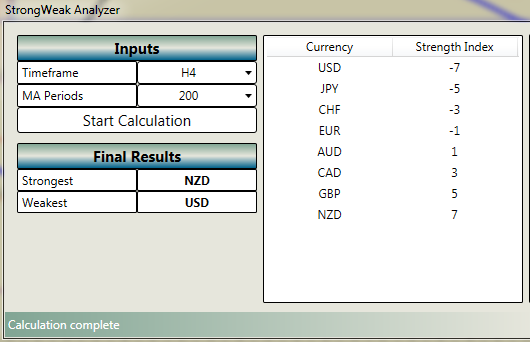
Therefore, even a weak Canadian Dollar may not be an attractive sell against an even weaker US Dollar as Rate Hike Expectations are quickly diminishing following Tuesday’s Non-Manufacturing-ISM that compounded the worse than expected Non-Farm Payrolls on Friday. Another takeaway from the BoC meeting on Wednesday was that their language suggested the economic contraction in Q2 went deeper than expected, and therefore, a recovery may take longer than expected.
To get a feel for where we stand, and where we could be heading, let’s go to the charts:
Technical Focus:

Interested In Learning the Traits of Successful Traders? If So, Click Here
The chart above is showing the overall sideways price action since May. You can see a clear support and resistance that has taken place at ~1.2700 & ~1.31/3200 respectively. The Ichimoku Cloud is helpful mainly by showing that we are coming into resistance after trading at a lower-high in early September. A breakdown from here could put pressure and possible break ~1.2700 that would open up the chart for a test of the 1.2459 low in early May.
While price action did move higher in USD/CAD following the BoC decision, most of the action was in crosses against strong currencies like NZD/CAD, which is getting close to all-times highs and AUD/CAD. Both commodity currencies have a distinct advantage over the CAD in the current environment given their relatively high yield.
As price action moves sideways, the bias of the following move comes from the directional bias of the move preceding the consolidation. The move before the May-Present range was decisively lower taking USD/CAD from ~1.46 down to ~1.25. The weak US Dollar may succumb to the Canadian Dollar, and a break sub-1.27 would likely open up the possibility of CAD joining other commodity FX bloc currencies that are winning over the USD.
USD/CAD Speculative Sentiment Index as of Wednesday, September 07, 2016

Combining the technical picture above, with the sentiment picture, and the Intermarket analysis, there is emerging evidence for a possible push lower. However, you can see above that there is little conviction give the range-bound environment and uncertainty surrounding the US Dollar.
The ratio of long to short positions in the USDCAD stands at 1.49 as 60% of traders are long. Yesterday the ratio was 1.60; 62% of open positions were long. Long positions are 0.1% lower than yesterday and 32.1% above levels seen last week. Short positions are 7.6% higher than yesterday and 19.4% below levels seen last week. Open interest is 2.9% higher than yesterday and 10.4% above its monthly average.
We use our SSI as a contrarian indicator to price action, and the fact that the majority of traders are long gives a signal that the USDCAD may continue lower. The trading crowd has grown less net-long from yesterday but unchanged since last week. The combination of current sentiment and recent changes gives a further mixed trading bias.
Key Levels as of Wednesday, September 07

T.Y.
file://nyc-daily-14152/Users/drodriguez/Desktop/VolumeAtPrice/SSI.htmlhttps:/www.fxcm.com/resources/education/guides/traits-of-successful-traders/?utm_source=DailyFX&utm_medium=Yell&utm_campaign=Article


