


Talking Points
-USD/CAD breaks higher, but doesn’t follow through
-Tight confluence of resistance in USD/CAD near 1.3304-1.3381
-OBV is bearish, SSI is bullish; Follow GSI for clues if the price zone may hold or break
Have you ever had one of those cars that wasn’t reliable? You know, the one that when you put it into gear, it would frequently stall out on you. Well, USD/CAD reminds me of such a car.
USD/CAD broke higher on Monday, but has offered little by way of additional follow through. On Monday, we wrote how the Loonie has reached its highest level in 4 months. The breakout has been less than dramatic. Since Monday, USD/CAD has traded sideways in a very tight 95 pip range.
We identified in Monday’s report four different levels that may offer resistance in the coming days. Those levels still hold and are bound by 1.3304-1.3381. With significant amounts of resistance looming overhead, the inability to push further ahead suggests the path of least resistance may be lower. Volume, as measured through On Balance Volume (OBV) supports a weak outlook on price , too.
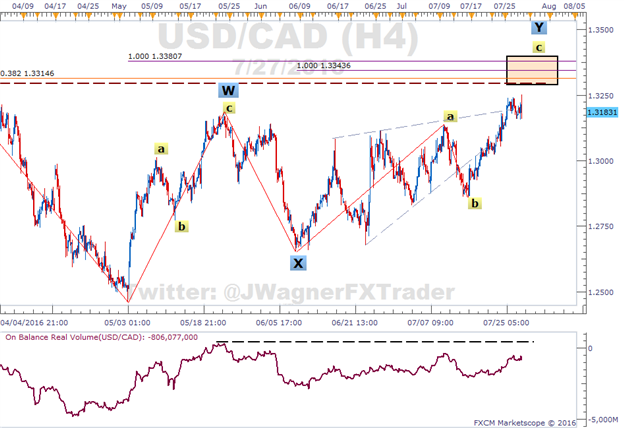
On Balance Volume (OBV) has been showing signs of a sideways range. As price pushed to a new 4 month high on Monday July 25, OBV was still well below levels seen in May. This divergence doesn’t look good for bulls as it says the amount of volume on up candles has been weak.
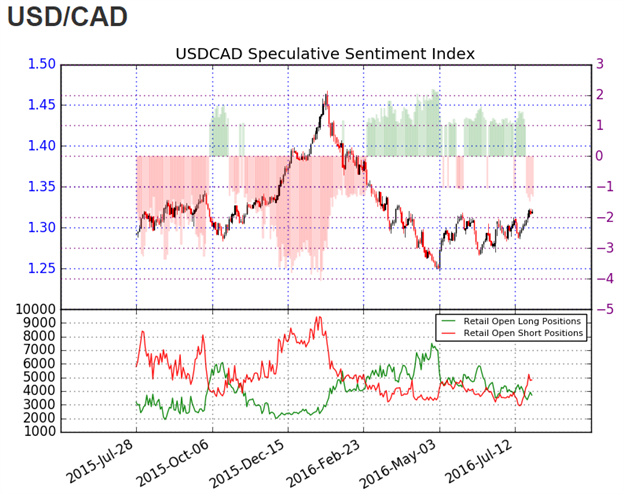
From a sentiment perspective, there might be a hint of bullishness, though it is weak. Even though the number of short traders has increased to 5 months highs (see sub-chart below) the substantial amount of overhead resistance is going to make for a murky journey. As a result, being positioned long at current price levels isn’t appetizing as the risk to reward ratio is skewed heavily against us which is not a trait of successful traders.
Suggested Reading:
Learn how to use USD/CAD live trader positioning in your trading decision
USD/CAD Technical Analysis – Breakout but How Far?
Bottom line, it may be best to wait for USD/CAD to push into the 1.3304-1.3381 resistance zone before initiating trades. Since we have mixed signals via OBV and SSI, perhaps lean to the Grid Sight Index for assistance as to the near term direction.
Interested in a quarterly outlook for USD or other markets? Download our quarterly forecast here.
---Written by Jeremy Wagner, Head Trading Instructor, DailyFX EDU
Follow me on Twitter at @JWagnerFXTrader .
See Jeremy’s recent articles at his Bio Page.
To receive additional articles from Jeremy via email, join Jeremy’s distribution list.


