


See How FXCM’s Live Clients Are Positioned in FX & Equities Here
Talking Points:
- USD/CAD Technical Strategy: Bears Be Warned, We’re on US Dollar Breakout Watch
- Trader Sentiment Warns a Coiled Move Lower or Higher Could Be Around the Corner
- USD/CAD Focus Turns to Recent High of 1.3015 for Potential Breakout Toward 1.3250
Wednesday saw a strong break higher in USD/CAD. First, the move higher off the weekly pivot developed on volatility in WTI Crude Oil (CFD: US Oil), but followed through with the resilient US Dollar getting more fuel for the potential road ahead at the hands of the Federal Reserve’s release of April FOMC Minutes.
Surprising to many, WTI Crude Oil has recently broken away from many prior correlations that held at the beginning of the year. As of today, the 30-day correlation of SPX500 to Oil hit YTD low of +0.18 on a correlation coefficient reading whereas +1.00 is a perfectly positive correlation.
Today’s DOE Inventory data surprised investors as the EIA reported that there was a surprisingly large build of North American inventories to the tune of ~1.3mn/bbl. Many were expecting a large drop due to the devastating wildfires in the Oil-rich are of Alberta Canada. Much of the gain in inventories were at the hands of Iraq supply coming at its highest clip in ~2yrs.
In addition to the divergence of the Oil correlation and US Dollar strength, directional guidance can be found in the US/CA 2-yr sovereign yield. In addition to sentiment, explained below, US/CA 2-yr yield spreads have been helpful to see which Dollar has the upper-hand. Today’s move aligns with the widest yield spread favoring USD strength in a month, and we’ve moved to the 3-month average spread at -26.8, which could mean a further reversion to the mean (i.e. higher) could be in the works.
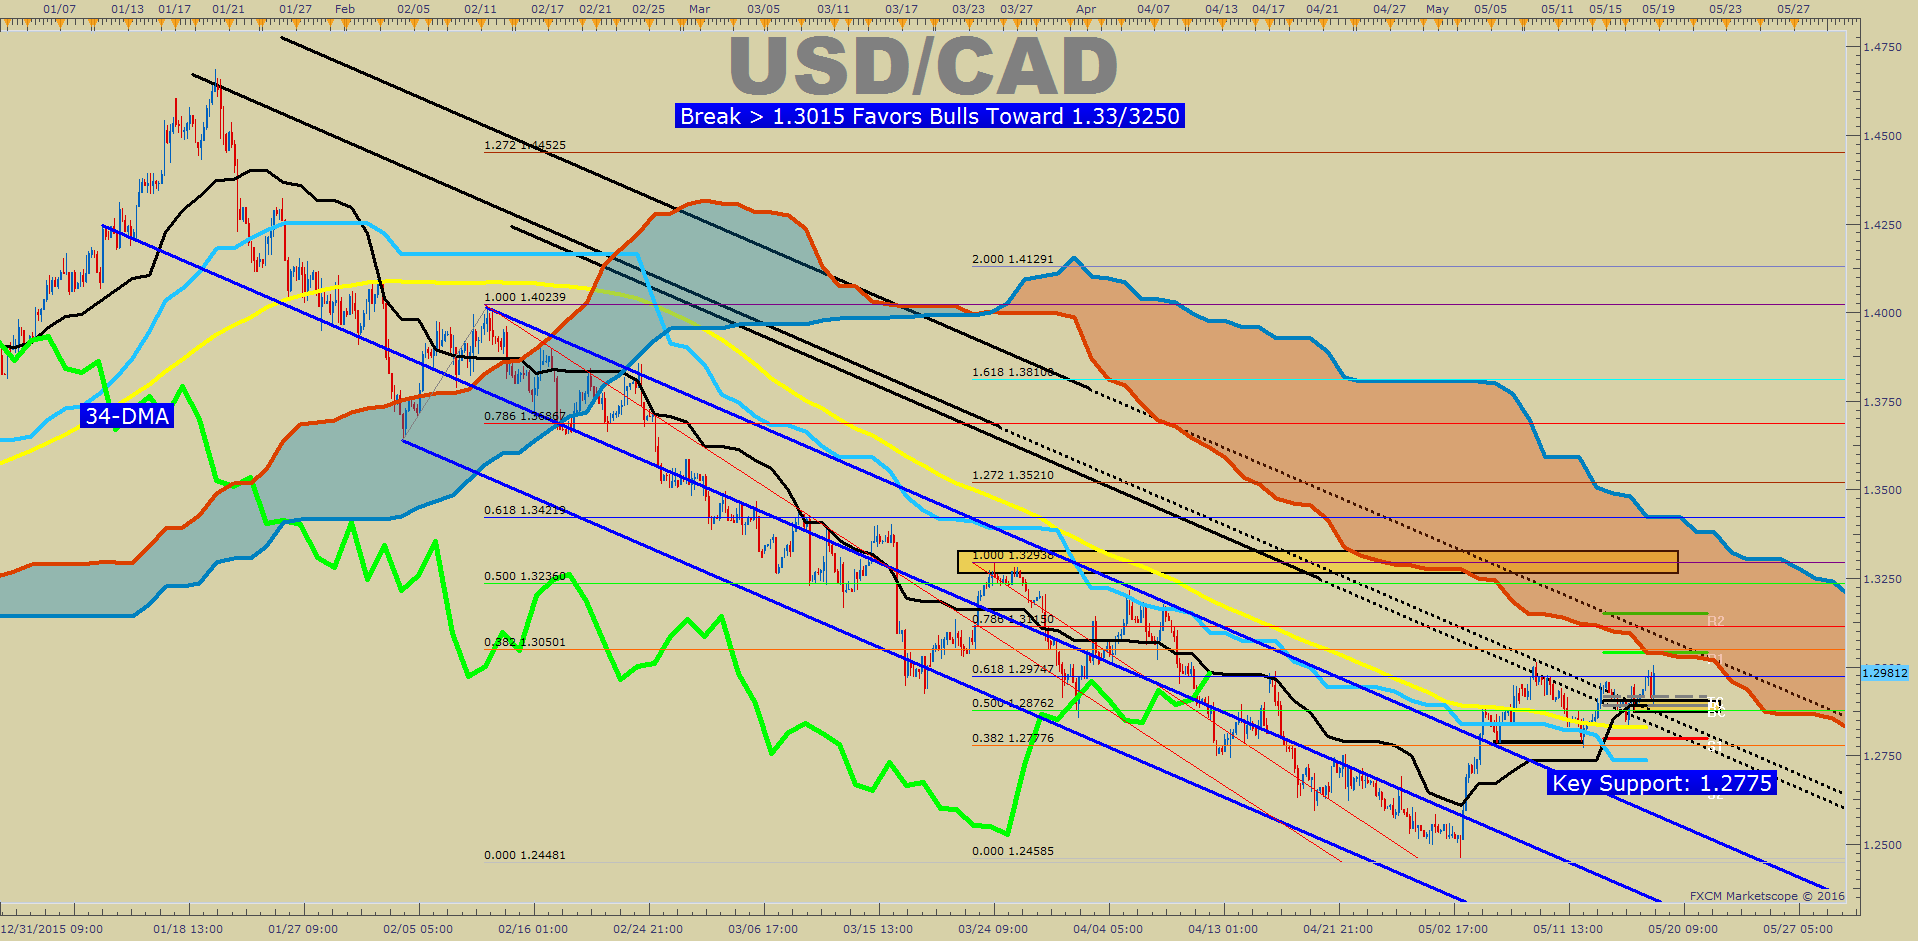
USD/CAD Is Breaking Out Of Multi-Month Bear Channel (H4 Chart)
Interested In Learning the Traits of FXCM’s Successful Traders? If So, Click Here
Even with the above information, it appears now that USD/CAD is in a state of flux. You will see below that our proprietary Sentiment System shows a nearly flat market. Therefore, the potential for a breakdown or breakout from a positioning standpoint seems equally likely. However, Wednesday’s break above 1.3015 could entice mean reversion traders to jump in and try to chase and push USD/CAD toward 1.3250/33.
Key Support Levels from Here (Visual Map Below)
Regarding resistance, the important 1.3015 level has been taken out on the post-FOMC USD move. Recently, we warned of a bullish falling wedge breaking out toward the start of the wedge near 1.3250. Now that the price has broken above the recent weekly high of 1.3015, we could soon see a strong break toward ~1.3250-1.3300 that also aligns with the 38.2% Fibonacci Retracement of the January 20 to early May Range.
Two checkpoints that Bulls can keep an eye on is the Weekly Resistance levels from classical pivot points. The R1 sits at 1.3042, which is within an earshot of the price near the close on Wednesday. The Weekly R2 sits well within the Daily Ichimoku Cloud at 1.3150.
As of Mid-Day Wednesday, the LoD is near the weekly pivot, which shows the Bears never had control this week or for that matter, most of the month. Should the weekly pivot fail to hold up the price once again and start acting like resistance, we could see the downtrend regain its steam. Beyond the Weekly Pivot at 1.2905, recent price action support is aligned with recent corrective lows near 1.2775. The 34-DMA in yellow on the chart above aligns with the weekly low at 1.2830. Therefore, there is a lot of support between 1.2775-1.2906 that could bring nice levels for value buyers to load into a potential risk-adjusted trade.
Showcase your trading skills against your peers in FXCM's $10,000 Monthly Challenge with a Mini Account.
Canadian Dollar Has Lost Favor per Sentiment
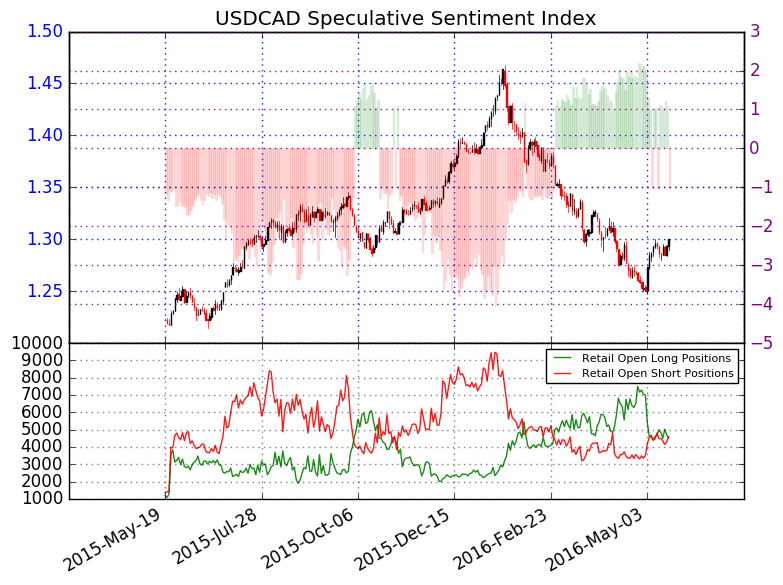
When looking at sentiment, crowd positioning has neutralized after a strong downtrend. For those familiar with our model, USD/CAD provided one of the strongest signals for downtrend continuation from late February to May. We use our Speculative Sentiment Index as a contrarian indicator to price action, and the fact that the majority of traders are near net-flat at a bull: bear of 1.12 as 53% of traders are long shows us a larger shift may be underway.
Long positions are 3.0% higher than yesterday and 12.6% above levels seen last week. Short positions are 4.7% higher than yesterday and 11.1% above levels seen last week. Open interest is 3.8% higher than yesterday and 3.9% below its monthly average. The neutralized positioning signal keeps us on high alert for the next big bias shift. As you can see, SSI has been particularly helpful with catching the big moves in USD/CAD.
USD/CAD Speculative Sentiment Index as of Wednesday, May 18, 2016
Combining the technical picture above, with the sentiment picture, and the Intermarket analysis support further warns of more CAD gains ahead against the US Dollar.
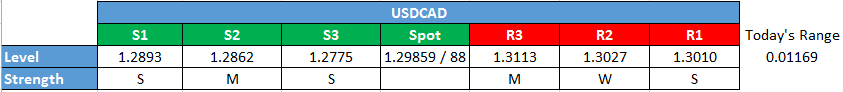
Key Levels as of Wednesday, May 18, 2016
T.Y.


