To receive Tyler’s analysis directly via email, please SIGN UP HERE
Talking Points:
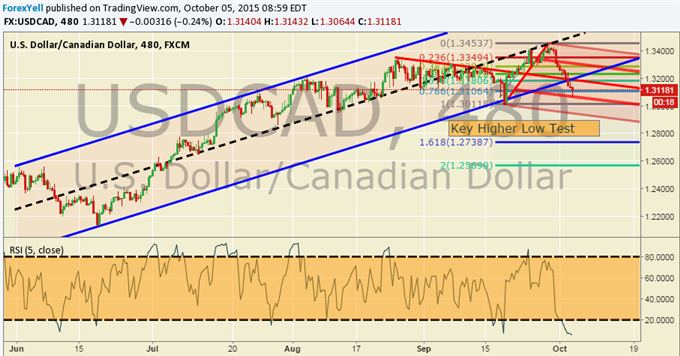
- USD/CAD Technical Strategy: Bearish Key Weekly Candle now Resistance
- Support Zone of 1.2950 /1.3012 in Focus
- Oversold RSI Warns of Bounce Higher / Likely Better Levels to Sell
Commodity currency strength has been a key theme after a disappointment Non-Farm Payroll in the United States. However, USDCAD did not wait until Non-Farm Payroll to start its counter-trend rally and was, in fact, been lower in each day of this young month. After we closed below 1.3175 setting-up a Bearish Key week reversal, we can look at last week’s high as ominous resistance as Bearish key weekly patterns on weekly candles are aggressive reversal signs. This week’s Canadian Employment report could further confirm whether medium term reversal in favor of the CAD is on our hands.
This incredibly strong trend looks to be wobbling, and we should look for a test and possible erosion of key trend structure support of 1.30 and 1.2950.Longer-term, it is difficult to doubt the USDollar, but USDCAD could make an argument on the September low at 1.3012, and recent low was respected at 1.2950. The 1.2950 low came at multiple technical confluence points showing respect to the larger trend. Considering the follow through move off 1.2950 gave us 11-year highs it’s easy to see this as key support. As a reminder, we’re in the opening range of Q4 2015 where important highs and lows for the quarter are often set. Therefore, it’s worthwhile to be patient to see if the large trend reverses or resumes.
According to some of the great work from Kristian Kerr, the bounce off the 1.3450 zone aligned with multiple resistance points on longer-term charts. We are right to be sensitive to resumption signals that could send us much higher or reversal signals that could test the mid-20s if not lower. A break and close below 1.2950 would open the door to start focusing on selling short term strength and looking for a deeper retracement. The SSI shows that long positions have grown 61.2% over the last week, which may be an indication that a turn is coming as this number is aggressive.
Add these technical levels directly to your charts with our Support/Resistance Wizard app!