


To receive Ilya's analysis directly via email, please SIGN UP HERE
Talking Points:
- USD/CAD Technical Strategy: Flat
- Support: 1.1953, 1.1823, 1.1717
- Resistance: 1.2034, 1.2095, 1.2165
The US Dollar descended to challenge the bottom of its now-familiar range below the 1.20 figure against its Canadian namesake. A daily close below the 23.6% Fibonacci expansion at 1.1953 exposes the 38.2% level at 1.1823. Alternatively, a reversal above the 14.6% Fib at 1.2034 clears the way for a test of trend line resistance at 1.2095.
Risk/reward considerations argue against entering short with prices in close proximity to support. On the other hand, the absence of a defined bullish reversal signal suggests taking up the long side is premature. We will remain flat for now, waiting for an actionable opportunity to present itself.
Add these technical levels directly to your charts with our Support/Resistance Wizard app!
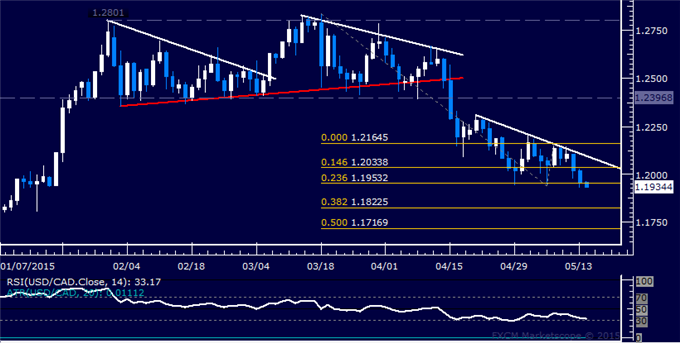
Daily Chart - Created Using FXCM Marketscope
--- Written by Ilya Spivak, Currency Strategist for DailyFX.com


