


USD Technical Outlook
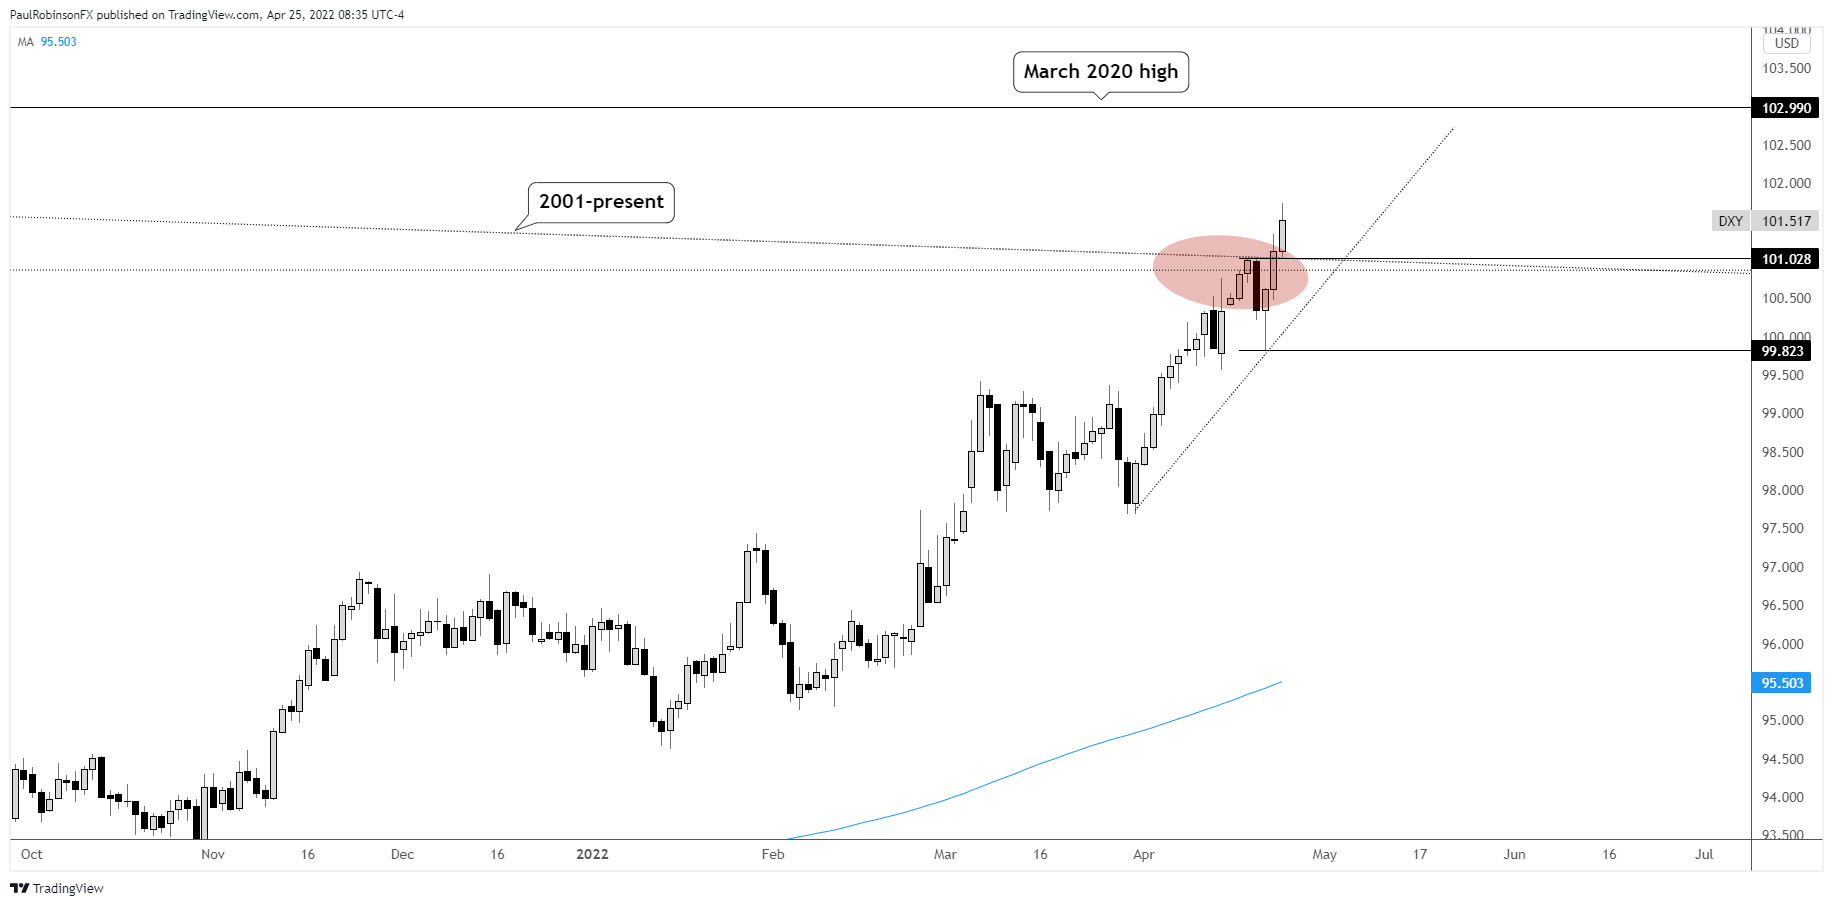
- US Dollar Index (DXY) trading around 21-year trend-line
- If momentum can continue then March 2020 high next
US Dollar Technical Analysis: DXY Trying to Cross 21-yr Trend-line
The US Dollar Index (DXY) is trying to cross a trend-line dating to 2001, a line that also connects the very important Covid 2020 high. The DXY is currently above the trend-line on a daily basis, but given its duration you need to get out a crayon to draw it and look at it on a weekly or even monthly basis.
Nevertheless, momentum has been strong and we could see the important March 2020 high at 10299 tested here shortly. Given the extend nature of the market it seems likely that on a first test of that high we may see at least a set-back induced, but we will need to wait and see how momentum is shaping up at that juncture.
For now, the outlook remains bullish until we see a sharp reversal lower. In the near-term we may see some support come in at a small peak created last week at 10103. This is also right around the long-term trend-line. Would-be longs looking to play the trend may look there for support or the trend-line off the end of March low.
A decline through that support won’t turn the outlook bearish, necessarily. The trend is strong and until we see a hard break and failure to rally it must be respected. A breakdown below last week’s low at 99.82 could start to set into motion a larger decline.
On the flip-side, shorts don’t hold any appeal given the lack of clear resistance. With that in mind, a spike to the March 2020 high could change that view if we see price action get volatile around that 10299 level.

US Dollar Index (DXY) Daily Chart
Resources for Forex Traders
Whether you are a new or experienced trader, we have several resources available to help you; indicator for tracking trader sentiment, quarterly trading forecasts, analytical and educational webinars held daily, trading guides to help you improve trading performance, and one specifically for those who are new to forex.
---Written by Paul Robinson, Market Analyst
You can follow Paul on Twitter at @PaulRobinsonFX


