


USD Technical Analysis
- US Dollar Index (DXY) turning down from resistance
- The turn down keeps it rangebound for now
- Trend remains overall bullish as long as support holds
US Dollar Technical Analysis: DXY Turn Lower Keeps it Rangebound for Now
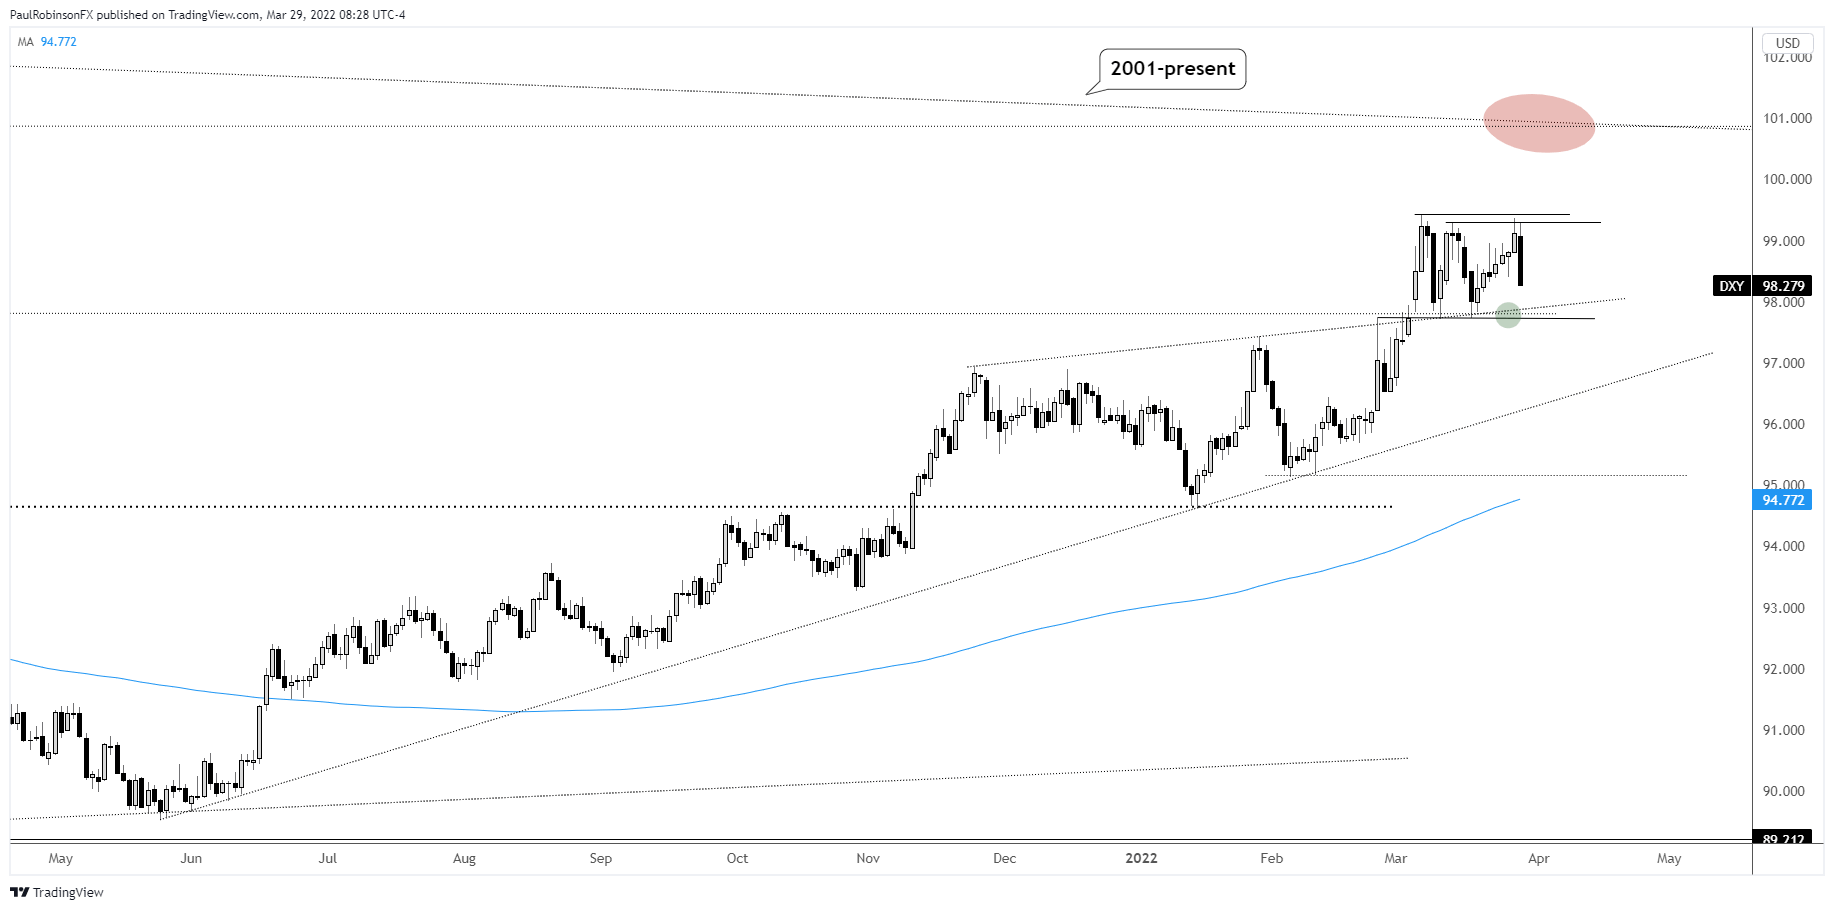
The US Dollar Index (DXY) is turning down hard off the early month highs, keeping it contained within a range. At this juncture it is difficult to read too much into the move given that range-trading continues to dominate.
What I will be looking for is if the bottom of the range can hold. The bottom of the range is at confluent support, which is seen as being key to a neutral to bullish outlook. The level is 97.71, and is made up of a slope from November, the Feb 24 Russian invasion high, and to a lesser degree a level from 2020.
Twice this month we have seen support hold well, with strong moves coming right after testing. We are likely to soon see if another test can keep DXY buoyed. From a risk/reward perspective, support could offer would-be longs an opportunity to enter with a line-in-the-sand to work with.
The broader trend is still higher, so the benefit of the doubt remains with support holding. But if we see it break on a daily closing basis, then look for the move lower to continue and maybe to a fairly sizable degree. The next line of support to watch on a breakdown is the trend-line from the May low. This lies a good ways lower than the 97.71 support shelf.
For now, in wait-and-see-mode until support is tested, or if we see the DXY turn around and break the 99.42 high, another leg higher could gain steam towards the trend-line from 2001 to current that resides just below the 101 mark.

US Dollar Index (DXY) Daily Chart
Resources for Forex Traders
Whether you are a new or experienced trader, we have several resources available to help you; indicator for tracking trader sentiment, quarterly trading forecasts, analytical and educational webinars held daily, trading guides to help you improve trading performance, and one specifically for those who are new to forex.
---Written by Paul Robinson, Market Analyst
You can follow Paul on Twitter at @PaulRobinsonFX


