


US Dollar Outlook:
- The US Dollar (via the DXY Index) has plunged ahead of the January US NFP report, wiping out all of the gains around the January Fed meeting.
- With Fed hike odds staying elevated, USD/JPY rates have been surprisingly resilient in the face of broader US Dollar weakness and a drop in US equity markets.
- The IG Client Sentiment Index suggests that USD/JPY has a mixed bias in the near-term.

Last Week’s Gains Gone, and Then Some
It’s been an absolutely brutal week for the US Dollar. The DXY Index has erased all of the gains last week accumulated around the January Fed meeting, mainly for two reasons. First, expectations for the US jobs report have deteriorated rapidly following the January US ADP report. Second, the European Central Bank’s surprise shift towards opening the door for rate hikes this year has provided a significant lift to the Euro, which is the largest component of the DXY Index (57.6% weighting).
Thus in lies the quandary for the US Dollar: a weak US NFP report has been mostly priced in, but with US inflation rates still at 40-year highs, the odds that the Fed backs off its aggressive hawkish path seem unlikely. It may be the case that the US NFP report tomorrow provokes an exhaustion sell-off, whereby the US Dollar stabilizes soon thereafter. In particular, if the US Dollar is able to gain ground, USD/JPY rates are easily in the best position among the major USD-pairs.
Hawkish Fed Still in the Picture
We can measure whether a Fed rate hike is being priced-in using Eurodollar contracts by examining the difference in borrowing costs for commercial banks over a specific time horizon in the future. Chart 1 below showcases the difference in borrowing costs – the spread – for the February 2022 and December 2023 contracts, in order to gauge where interest rates are headed by December 2023.
Eurodollar Futures Contract Spread (FEBRUARY 2022-DECEMBER 2023) [BLUE], US 2s5s10s Butterfly [ORANGE], DXY Index [RED]: Daily Timeframe (August 2021 to February 2022) (Chart1)
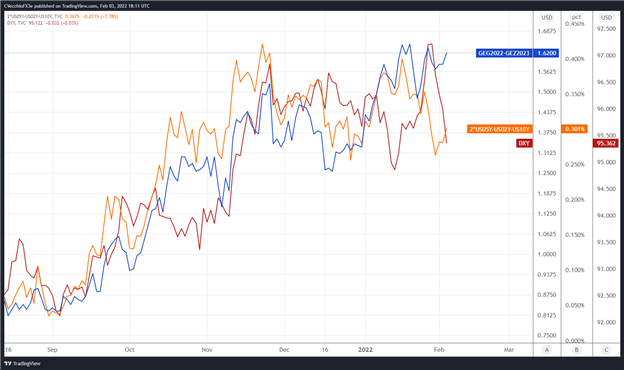
By comparing Fed rate hike odds with the US Treasury 2s5s10s butterfly, we can gauge whether or not the bond market is acting in a manner consistent with what occurred in 2013/2014 when the Fed signaled its intention to taper its QE program. The 2s5s10s butterfly measures non-parallel shifts in the US yield curve, and if history is accurate, this means that intermediate rates should rise faster than short-end or long-end rates.
There are 162-bps of rate hikes discounted through the end of 2023 (six-plus 25-bps rate hikes), just off a cycle high, while the 2s5s10s butterfly spread is holding near its levels from late-December and late-January. The disconnect seen in recent days may be a function of markets pricing in a weak January US nonfarm payrolls report, which has seen expectations slashed after the January US ADP employment change report earlier this week showed a loss of -301K jobs. The odds have increased that the January US NFP figure may show a contraction; however, the Bloomberg News consensus forecast is still for +150K.
DXY PRICE INDEX TECHNICAL ANALYSIS: DAILY Timeframe (January 2021 to February 2022) (CHART 2)
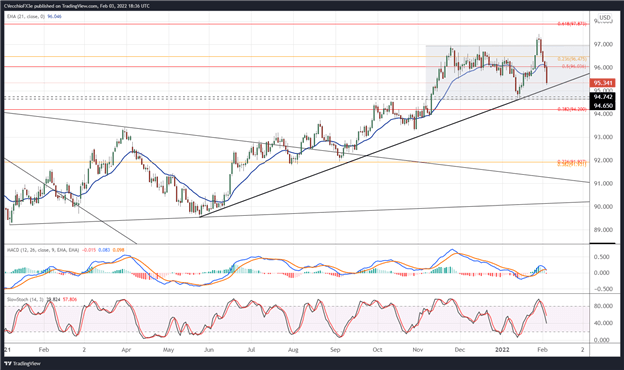
All of the DXY Index’ gains from last week have been erased, and the greenback gauge is now poised to secure two consecutive closes below its daily 21-EMA (the one-month moving average) for the first time since late-December. Loss this week have seen the DXY Index drop through a confluence of Fibonacci levels: the 50% retracement of the 2017 high/2018 low range at 96.04; and the 23.6% retracement of the 2011 low/2017 high range at 96.48.
A deeper setback may take place before the lows are found. Rising trendline support from the May 2021 and January 2022 swing lows comes in closer to 95.15 by the end of the week, while the 2022 lows are down near 94.63 – right near where the March 2020 low, September 2020 high, and September to early-November 2021 highs were carved out. With Fed rate hike odds intact, it may be the case that the area around 94.63 represents the opportune risk/reward level by which to seek long opportunities again.

USD/JPY RATE TECHNICAL ANALYSIS: DAILY TIMEFRAME (January 2020 to February 2022) (CHART 3)
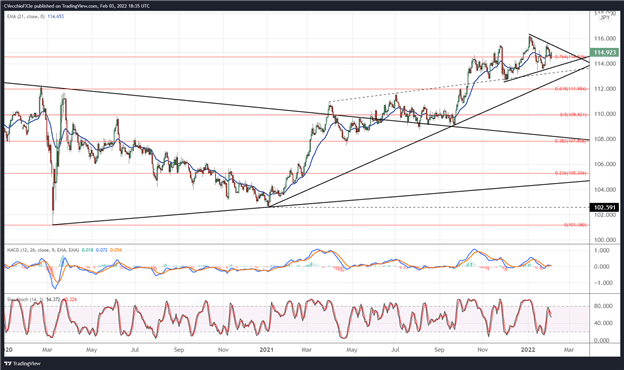
While the DXY Index has struggled, USD/JPY rates have proved incredibly resilient. The sideways movement that originated in October has continued. It remains the case that “the give-and-take between US Treasury yields and US equity markets is mainly responsible for this churn, a dance that is unlikely to end any time soon. As such, a rally back above 116.00 may be seen as an opportunity to sell into range/channel resistance, while dips below 113.50 may be viewed as an opportunity to buy near range/channel support.” Ultimately, a symmetrical triangle may be forming since late-November, which in context of the preceding move, would look for resolution higher.
IG Client Sentiment Index: USD/JPY RATE Forecast (February 3, 2022) (Chart 4)
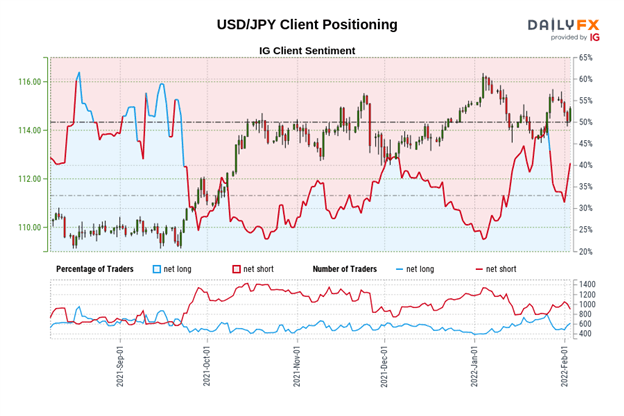
USD/JPY: Retail trader data shows 38.62% of traders are net-long with the ratio of traders short to long at 1.59 to 1. The number of traders net-long is 7.90% lower than yesterday and 0.55% higher from last week, while the number of traders net-short is 2.57% lower than yesterday and 10.02% lower from last week.
We typically take a contrarian view to crowd sentiment, and the fact traders are net-short suggests USD/JPY prices may continue to rise.
Positioning is more net-short than yesterday but less net-short from last week. The combination of current sentiment and recent changes gives us a further mixed USD/JPY trading bias.

--- Written by Christopher Vecchio, CFA, Senior Strategist


