USD Technical Outlook
- DXY rolling over out of a wedge pattern
- Slope support from June has been broken
US Dollar Technical Outlook: DXY Vulnerable into New Year
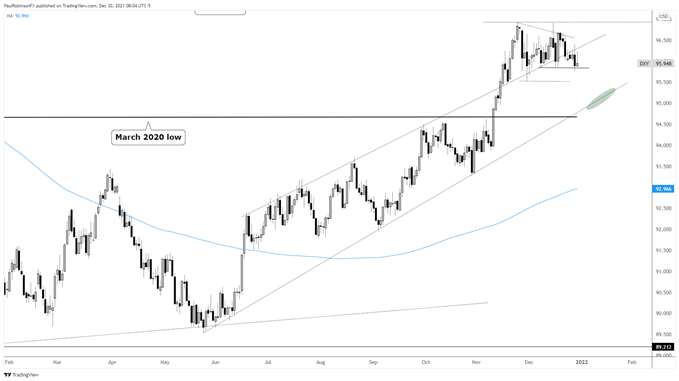
The US Dollar Index (DXY) had been in a wedge formation until yesterday, but has yet to close on a daily basis below 95.85. That level was created via lows on December 8 and 16, and the fact they were nearly identical in their prints it makes for a sturdy level.
While it was breached intra-day, we didn’t see a close below support. That has been a key factor we’ve discussed recently if the wedge is to break to the downside. The fact that the slope from June has been broken is big, but to see the DXY garner momentum it is seen as needing 95.85 to break.
Should we see that in the days ahead, then look for the bottom of the wedge to quickly come into play at 95.51. This is only viewed as minor support and lower levels are likely. The May trend-line and March 2020 low at 94.67 are the next meaningful levels to watch.
The trend for the dollar has been up for the better part of the year, so it would be an interesting test to see trend support come into play. At that time, should we see the aforementioned support come into play, then we can watch price action to help give us better indications as to whether a down-move is merely corrective in nature or means a larger trend reversal is underway.


US Dollar Index (DXY) Daily Chart

Resources for Forex Traders
Whether you are a new or experienced trader, we have several resources available to help you; indicator for tracking trader sentiment, quarterly trading forecasts, analytical and educational webinars held daily, trading guides to help you improve trading performance, and one specifically for those who are new to forex.
---Written by Paul Robinson, Market Analyst
You can follow Paul on Twitter at @PaulRobinsonFX


