


USD Technical Outlook
- US Dollar Index (DXY) pop and sudden reverse last week looks familiar
- If familiar pattern holds, then new cycle lows may be near
USD Technical Outlook: DXY Price Action Familiar, Suggests Selling Ahead
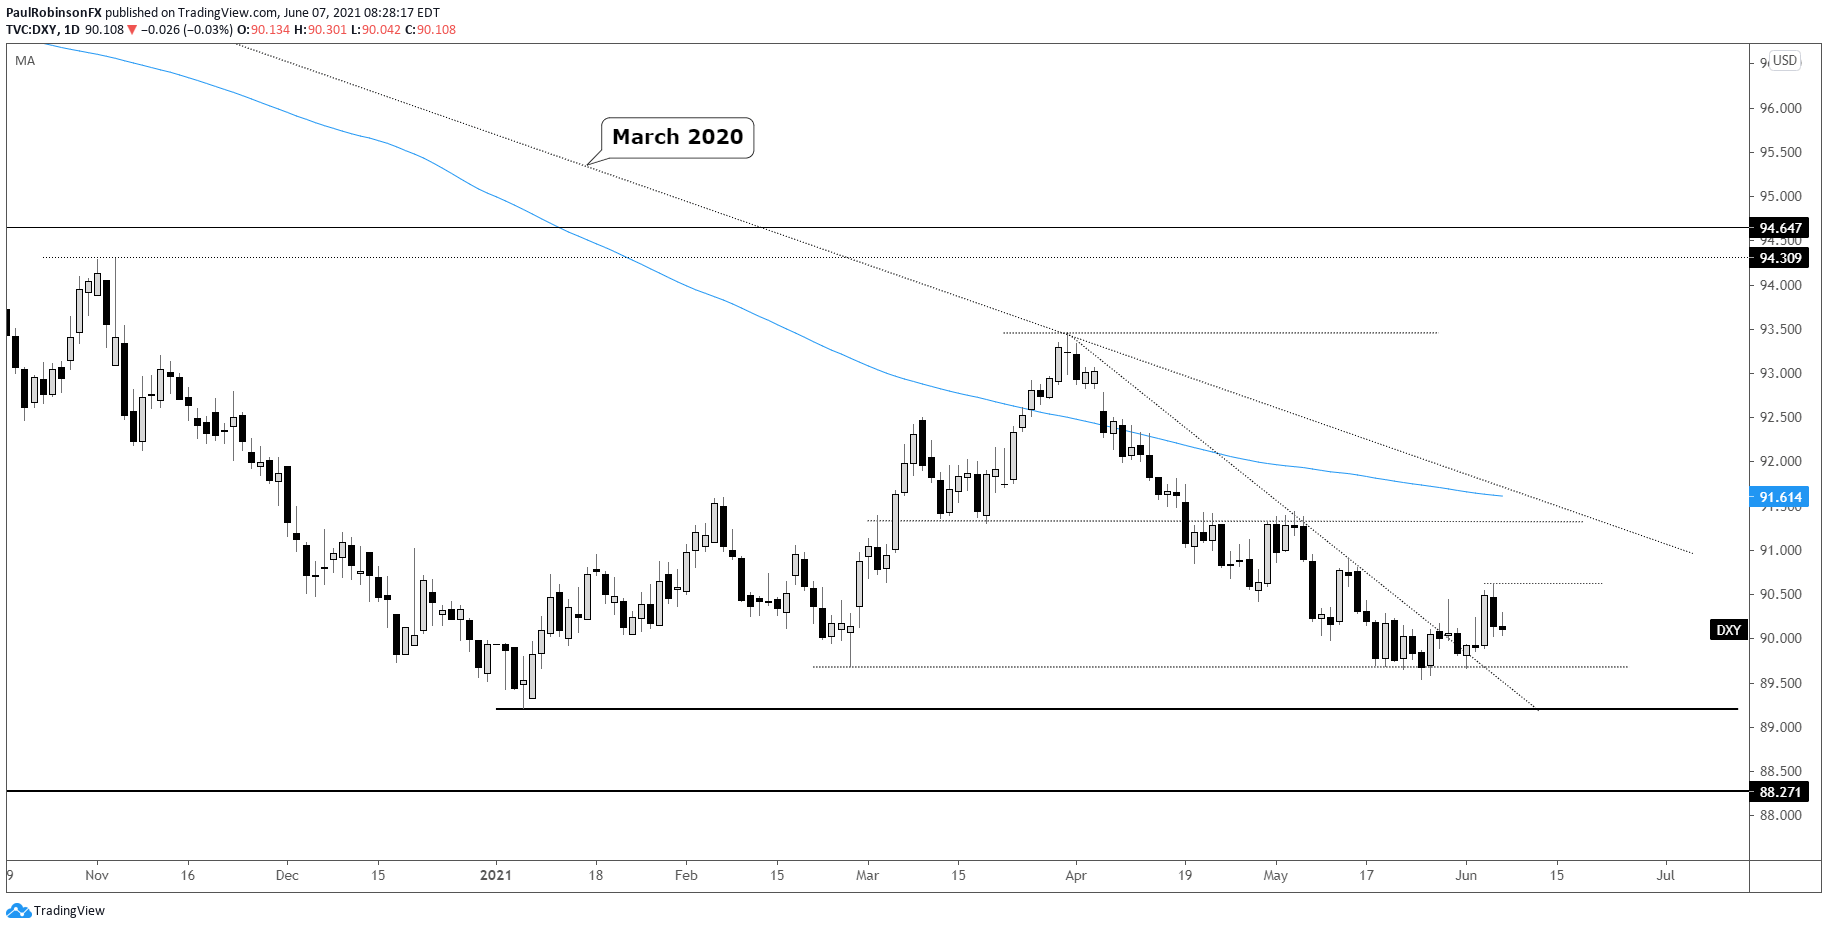
The US Dollar Index (DXY) price action is beginning to look like some of the same we’ve been seeing since the end of April. The hard pop on Thursday was quickly negated on Friday post-NFPs. Each of the last two times we have seen a big up day it was within days that a peak was found prior to sinking to a new cycle low.
Perhaps this time is different because it isn’t occurring from a swing-low, but the fact that the one-day rally has been almost entirely erased already suggests a swing-high may be in. If that is the case then strength from here should be very minimal until at least the 89.53 low created last month.
There is the potential that a bear-flag formation forms, best seen in development on the 4-hr time-frame. A bounce may develop off the lower parallel of the pattern that is forming, but again it should be minimal. If the May low at 89.53 breaks the next big level to watch is the yearly low at 89.20 and 2018 low at 88.25. The latter level would be a major test as it is a level that began over a decade ago.
On the flip-side, should we see a break above Friday’s high at 90.62, then the sequence discussed above will have failed and this would indicate that the tides could be turning. It would still be an uphill battle for USD, but encouraging signs that a broader recovery is underway. In this case, we would be looking for the 91.30/60s, where lies horizontal resistance, the March 2020 trend-line, and 200-day moving average.

US Dollar Index (DXY) Monthly Chart

US Dollar Index (DXY) Daily Chart
US Dollar Index (DXY) 4-hr Chart

Resources for Forex Traders
Whether you are a new or experienced trader, we have several resources available to help you; indicator for tracking trader sentiment, quarterly trading forecasts, analytical and educational webinars held daily, trading guides to help you improve trading performance, and one specifically for those who are new to forex.
---Written by Paul Robinson, Market Analyst
You can follow Paul on Twitter at @PaulRobinsonFX


