


USD Technical Outlook
- US Dollar Index (DXY) near yearly low, 2018 low
- Support zone runs back to the days of the 2008 crisis
US Dollar Technical Outlook: Long-term Levels Could Soon Bring Volatility
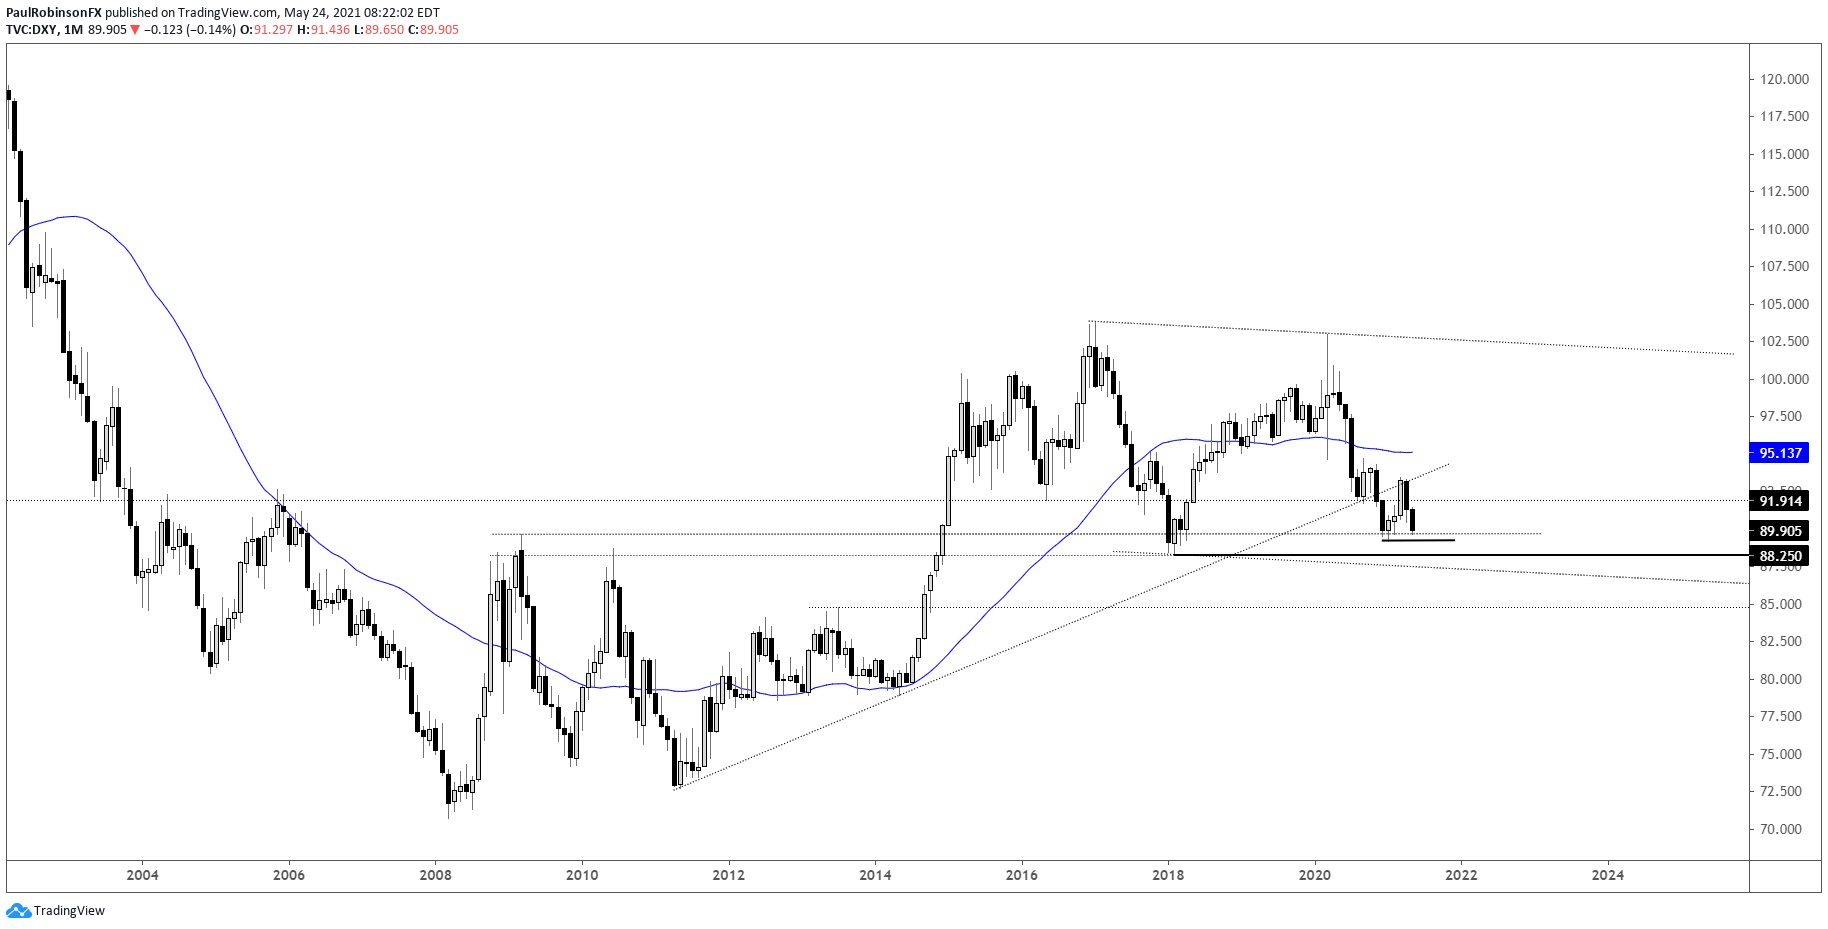
The price of the US Dollar Index (DXY) is trading near the 2021 low and not far above the 2018 low. The current vicinity of support runs back to the volatile days of the GFC in 2008. Any time a market is trading around long-term levels big price swings become the risk.
Given the significance of support it seems likely we may indeed soon get a big move. The 2021 low is 89.20, not very far from current levels, and beneath there is the 2018 low at 88.25.
The levels from the years earlier in 2008-2010 at that juncture would have been fully breached, and thus set the DXY up for increased downside momentum. There is possible parallel support from the 2016/2020 highs, but not a proven level yet.
But before thinking about an extended downside move, support is support until it isn’t. Risk of a bounce is high as the market has generally been bearish on the dollar for a while and to a large extent.
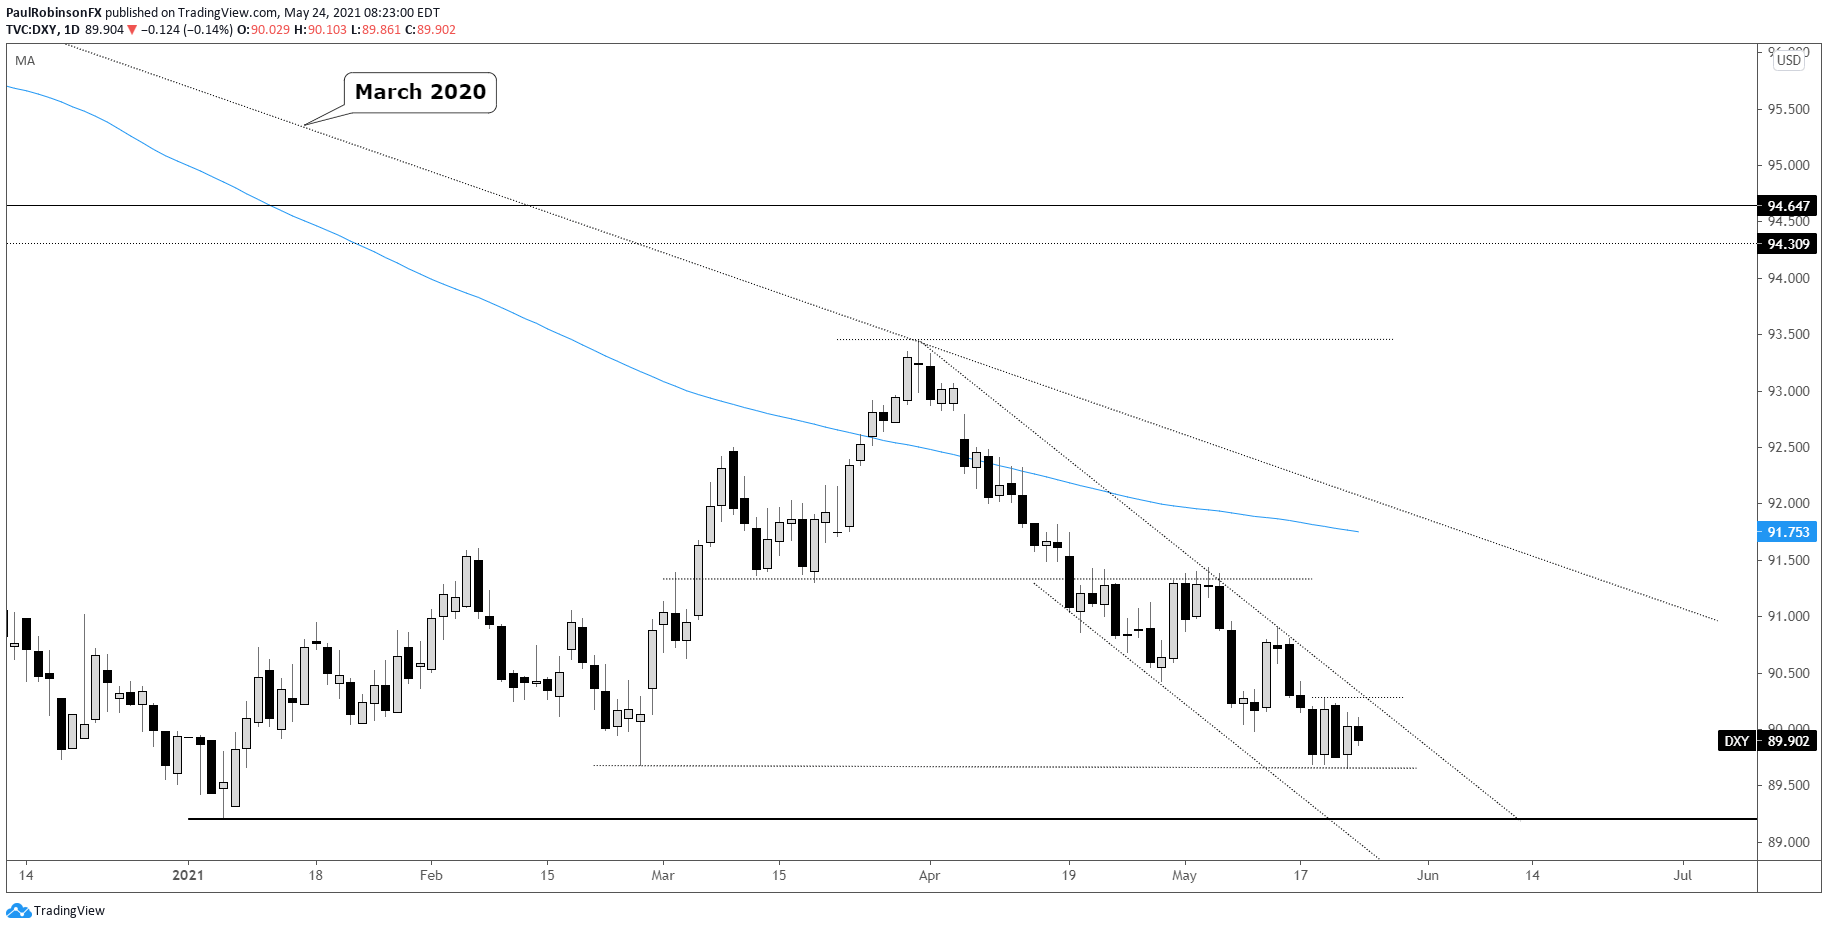
Looking at the shorter-term price action, the downtrend since the final day of March is still well intact. There is trend-line resistance off the Q1 high that is growing in importance, with it now connecting along three points.
The past few sessions have seen the DXY seesawing back and forth, one side or the other is set to give. On the downside, the recent lows have formed at a reversal day low in February.
A sustained breach of 89.65 will quickly have in focus the yearly low at 89.20. This is when things could become interesting and we will want to pay close attention to how price action behaves.
On the top-side, the first level of resistance is the trend-line from the March high and the recent high at 90.28. A breakout above these thresholds are needed to at least turn the dollar towards higher levels.
A burst higher would be preferred if we are to see a rally, as this would be a sign that the market is caught flat-footed. A low momentum move, even if above resistance, may only indicate a corrective bounce.
For now, the outlook in the near-term is neutral to bearish, but in genearal traders need to stay sharp here as risk of increased volatility continues to rise.

US Dollar Index (DXY) Monthly Chart (big levels nearby)
US Dollar Index (DXY) Daily Chart (short-term range set to break)
Resources for Forex Traders
Whether you are a new or experienced trader, we have several resources available to help you; indicator for tracking trader sentiment, quarterly trading forecasts, analytical and educational webinars held daily, trading guides to help you improve trading performance, and one specifically for those who are new to forex.
---Written by Paul Robinson, Market Analyst
You can follow Paul on Twitter at @PaulRobinsonFX


