


US Dollar Outlook:
- Rising US Treasury yields aren’t helping the US Dollar as rising inflation pressures are outpacing near-term growth expectations following the April US non-farm payrolls report.
- The DXY Index is sustaining the loss of its uptrend from its intrayearly swing lows, while USD/JPY rates are in the early stages of funneling into the vertex of a symmetrical triangle.
- The IG Client Sentiment Index suggests that USD/JPY has a bullish bias in the near-term.
US Dollar Bleeding Continues
The US Dollar can’t catch a break as May plods forward, despite seemingly having a tailwind amid the best month of the year from a seasonal perspective. Alas, the best laid plans of mice and men often go awry. This statement rings perfectly true for the US Dollar in the case of US Treasury yields, which have been steadily recovering since the disappointing April US non-farm payrolls report – and the US Dollar (via the DXY Index) has not benefited in the slightest. And yet this is not a surprising turn of events.

US Treasury Yield Curve (1-year to 30-years) (February 2020 to May 2021) (Chart 1)
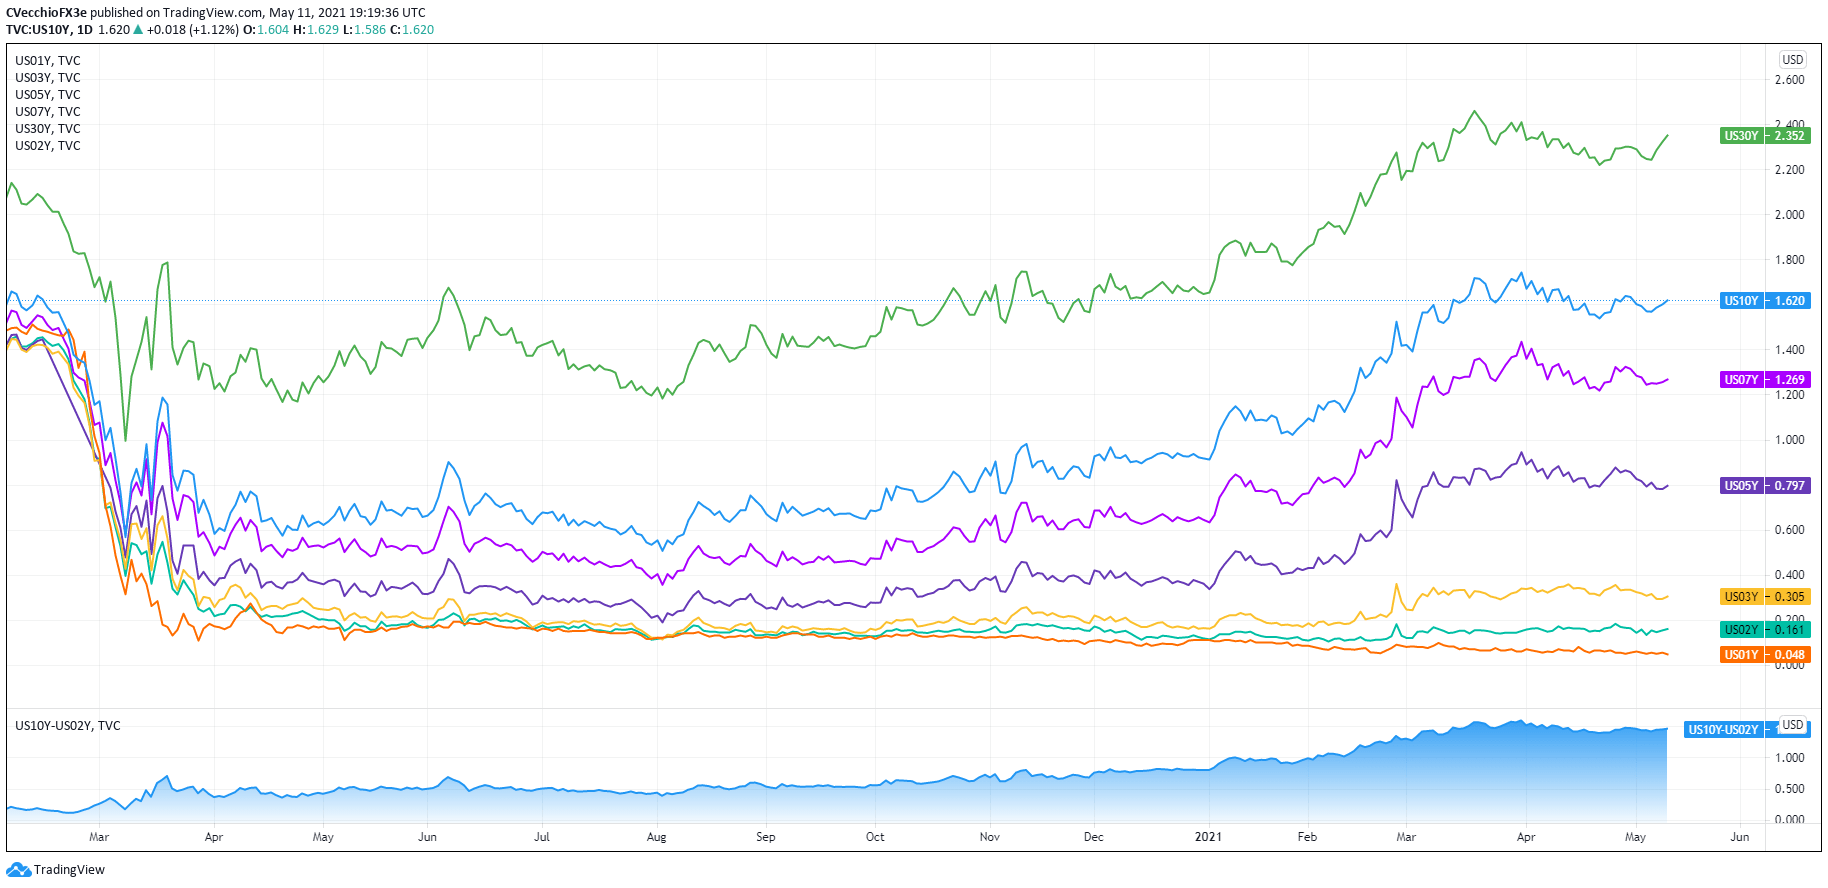
In the prior US Dollar forecast update, it was summarized that “US Dollar bulls should think twice before being lulled into a false sense of safety that rising US Treasury yields will automatically bring about greater fortunes for the DXY Index, even as the calendar turns to May.”
The rationale at the time remains viable: “there is a fly in the ointment: inflation pressures. With the Federal Reserve just yesterday signaling its intent to keep their main rate low come hell or highwater, the prospect for soft agricultural commodities like corn and wheat or industrial metals like copper to continue to rally in the near-term remains strong. Accordingly, rising near-term inflation expectations may outpace gains in US Treasury yields, which are nominal, thereby exerting downward pressure on real US yields again.”
Careening after the April US jobs report, the narrative around the US Dollar, US Treasury yields, and the US economy can only be restored by one development: better US economic data. The second half of this week has a distinct North American focus, providing the greenback ample opportunity to try and change the narrative.
DXY PRICE INDEX TECHNICAL ANALYSIS: DAILY CHART (March 2020 to May 2021) (CHART 2)
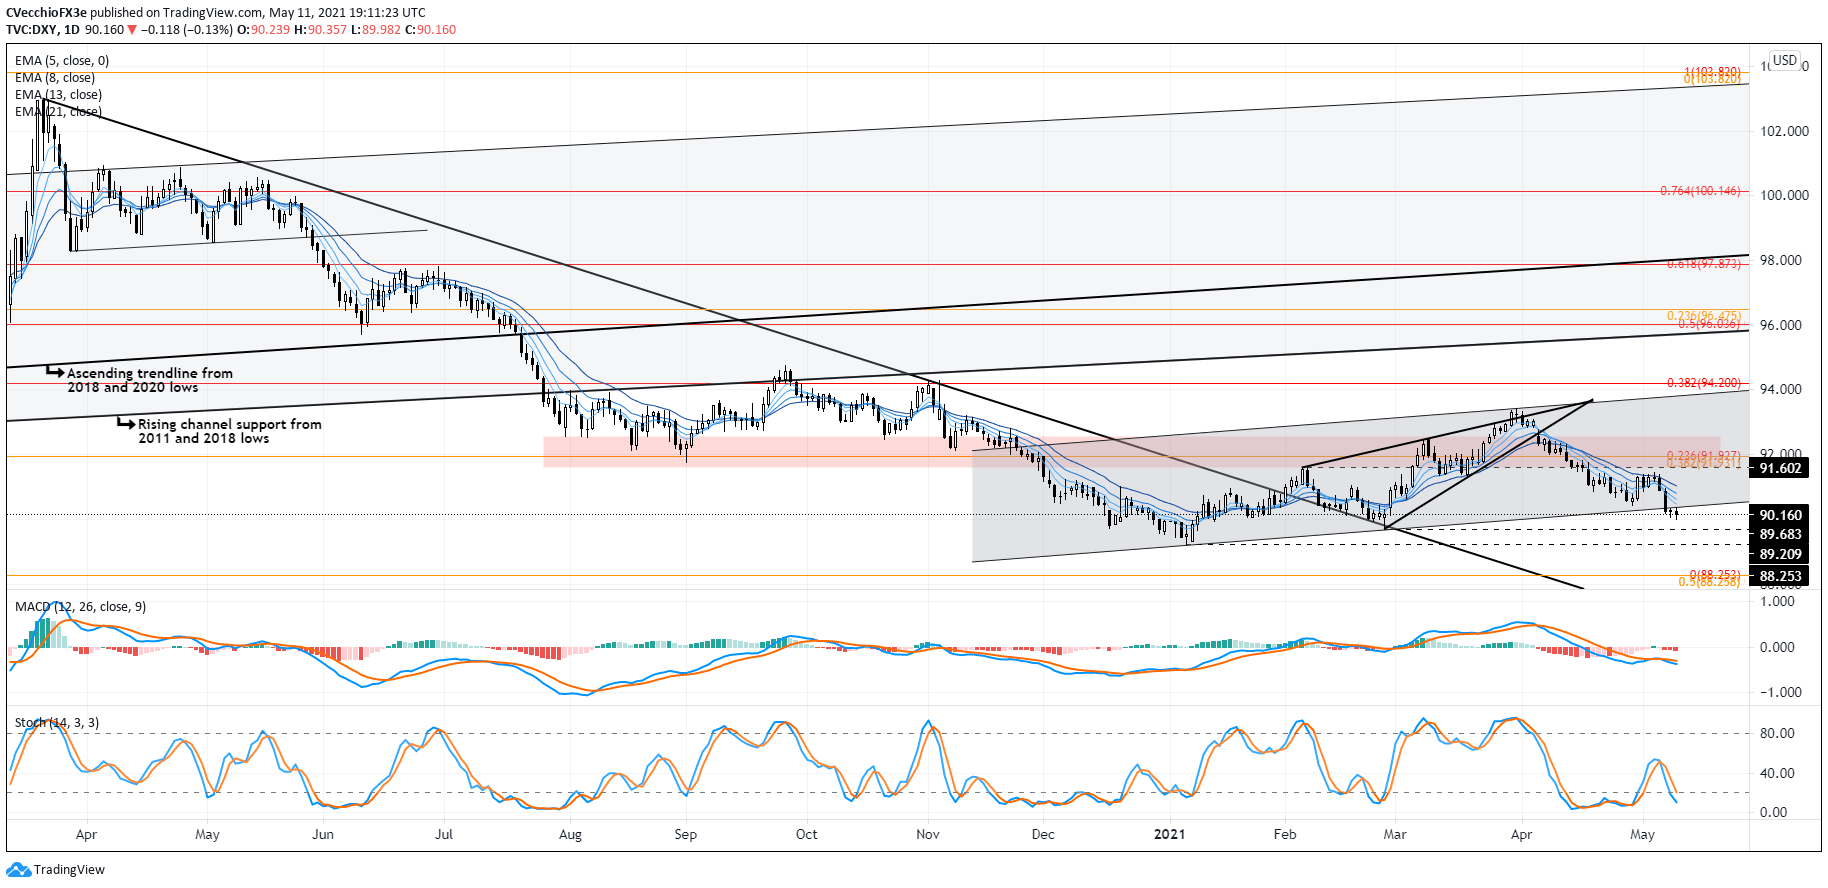
At the end of April it was noted that “with losses entrenched at the moment, it remains the case that ‘the DXY Index is in the throes of a bearish rising wedge formation, which ultimately calls for a return to the February low at 89.68.’…the path of least resistance may still be lower yet, until running into rising channel support off the January and February lows; this channel may ultimately prove to be a bear flag.” The DXY Index has dropped below this rising channel support, the uptrend from the intrayearly swing lows.
The broad US Dollar gauge is stillbelow its daily 5-, 8-, 13-, and 21-EMA envelope, which is in bearish sequential order. Daily Slow Stochastics have dropped back into oversold territory, while daily MACD is trending lower in bearish territory. Having not yet achieved 89.68 to the downside, the DXY Index may have more losses ahead.

USD/JPY RATE TECHNICAL ANALYSIS: DAILY CHART (March 2020 to May 2021) (CHART 3)
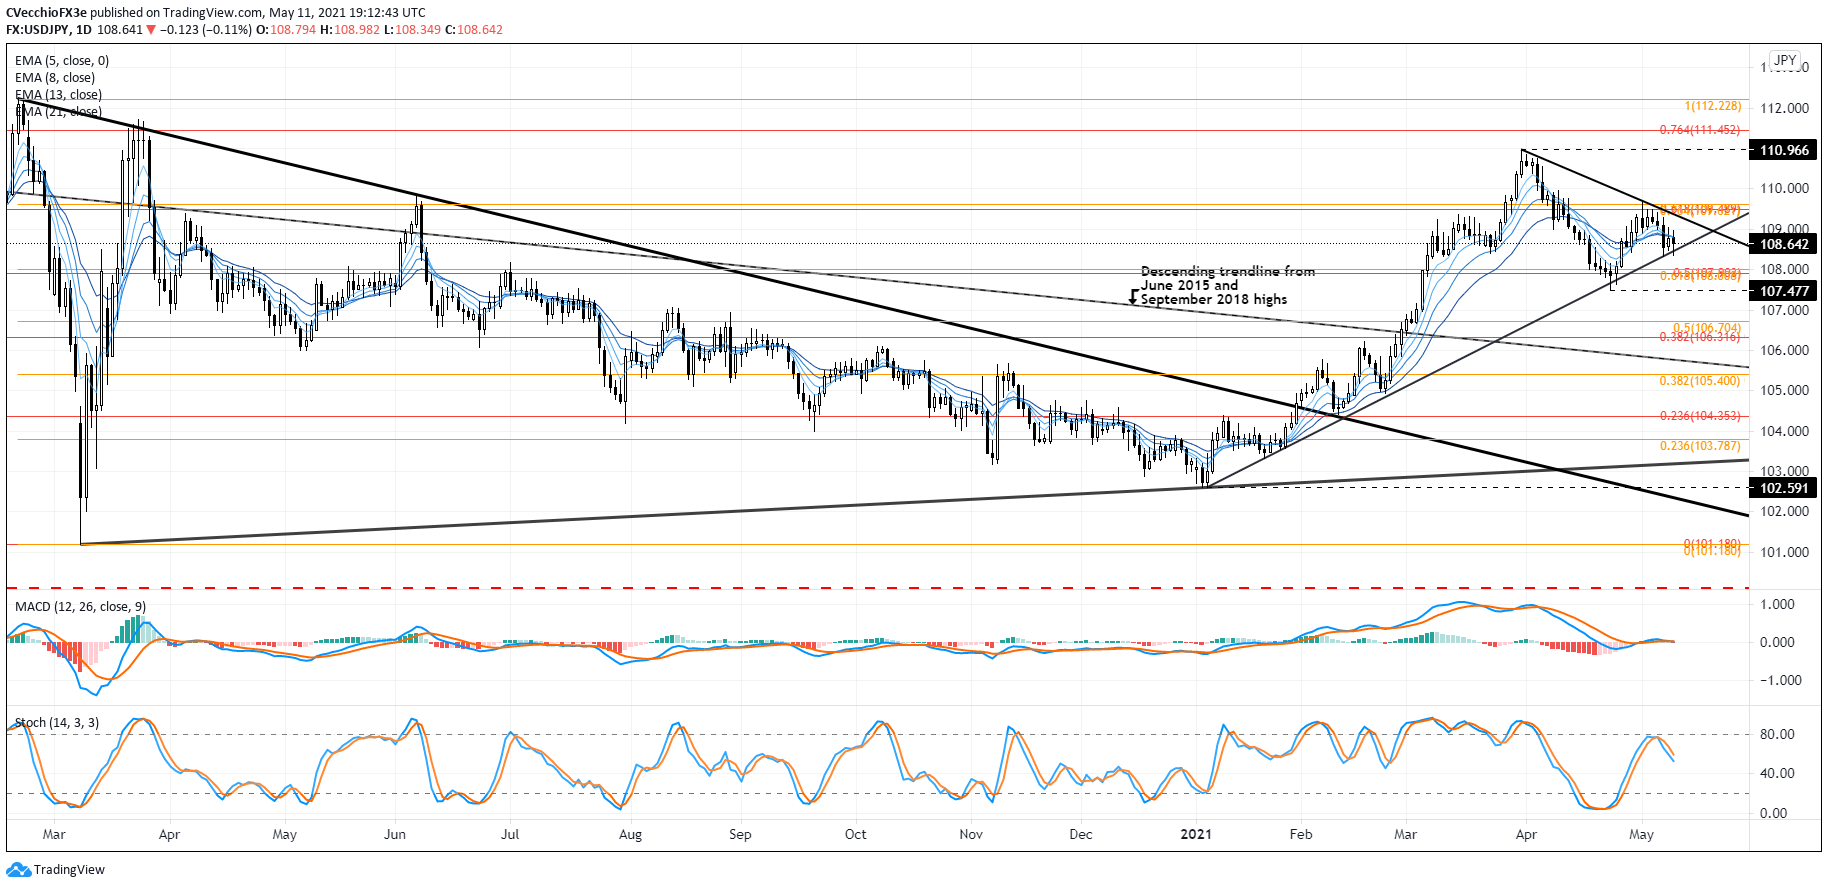
In the prior USD/JPY rate forecast update, it was noted that “the picture told by USD/JPY appears divergent from the DXY Index.” That turned out to be not entirely true; USD/JPY rates pulled back since the last update, although the pair sustained a more shallow pullback than other USD-pairs. To this end, it remains the case that USD/JPY appears on more stable if not bullish footing than the DXY Index.
USD/JPY rates may be starting to funnel into the vertex of a symmetrical triangle that’s materialized against the downtrend from the March and April swing highs and the January, February, and April swing lows. Contextually, the expected outcome is for a bullish resolution, given that the preceding move was a rally following the break of the descending trendline from the June 2015 and September 2018 highs.
If US Treasury yields can turn higher, “USD/JPY may be one of the few places of solace for USD bulls,” even if other USD-pairs are suffering.
IG Client Sentiment Index: USD/JPY RATE Forecast (May 11, 2021) (Chart 4)
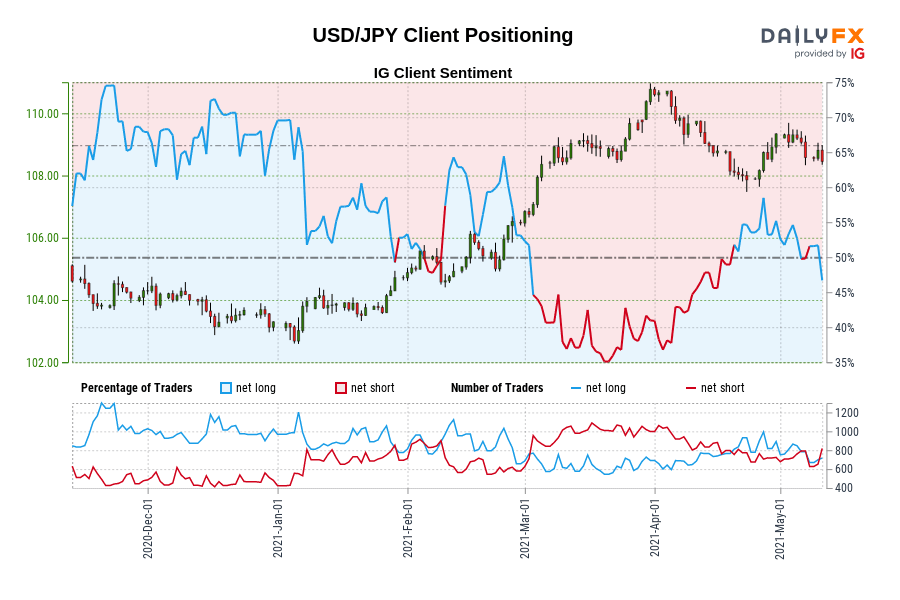
USD/JPY: Retail trader data shows 44.74% of traders are net-long with the ratio of traders short to long at 1.24 to 1. The number of traders net-long is 5.91% lower than yesterday and 20.19% lower from last week, while the number of traders net-short is 3.55% higher than yesterday and 14.97% higher from last week.
We typically take a contrarian view to crowd sentiment, and the fact traders are net-short suggests USD/JPY prices may continue to rise.
Traders are further net-short than yesterday and last week, and the combination of current sentiment and recent changes gives us a stronger USD/JPY-bullish contrarian trading bias.
--- Written by Christopher Vecchio, CFA, Senior Currency Strategist


