


USD Technical Outlook
- US Dollar Index (DXY) may soon put in a pattern failure
- Trend from March may be ready to resume towards 2018 low
USD at a critical spot here
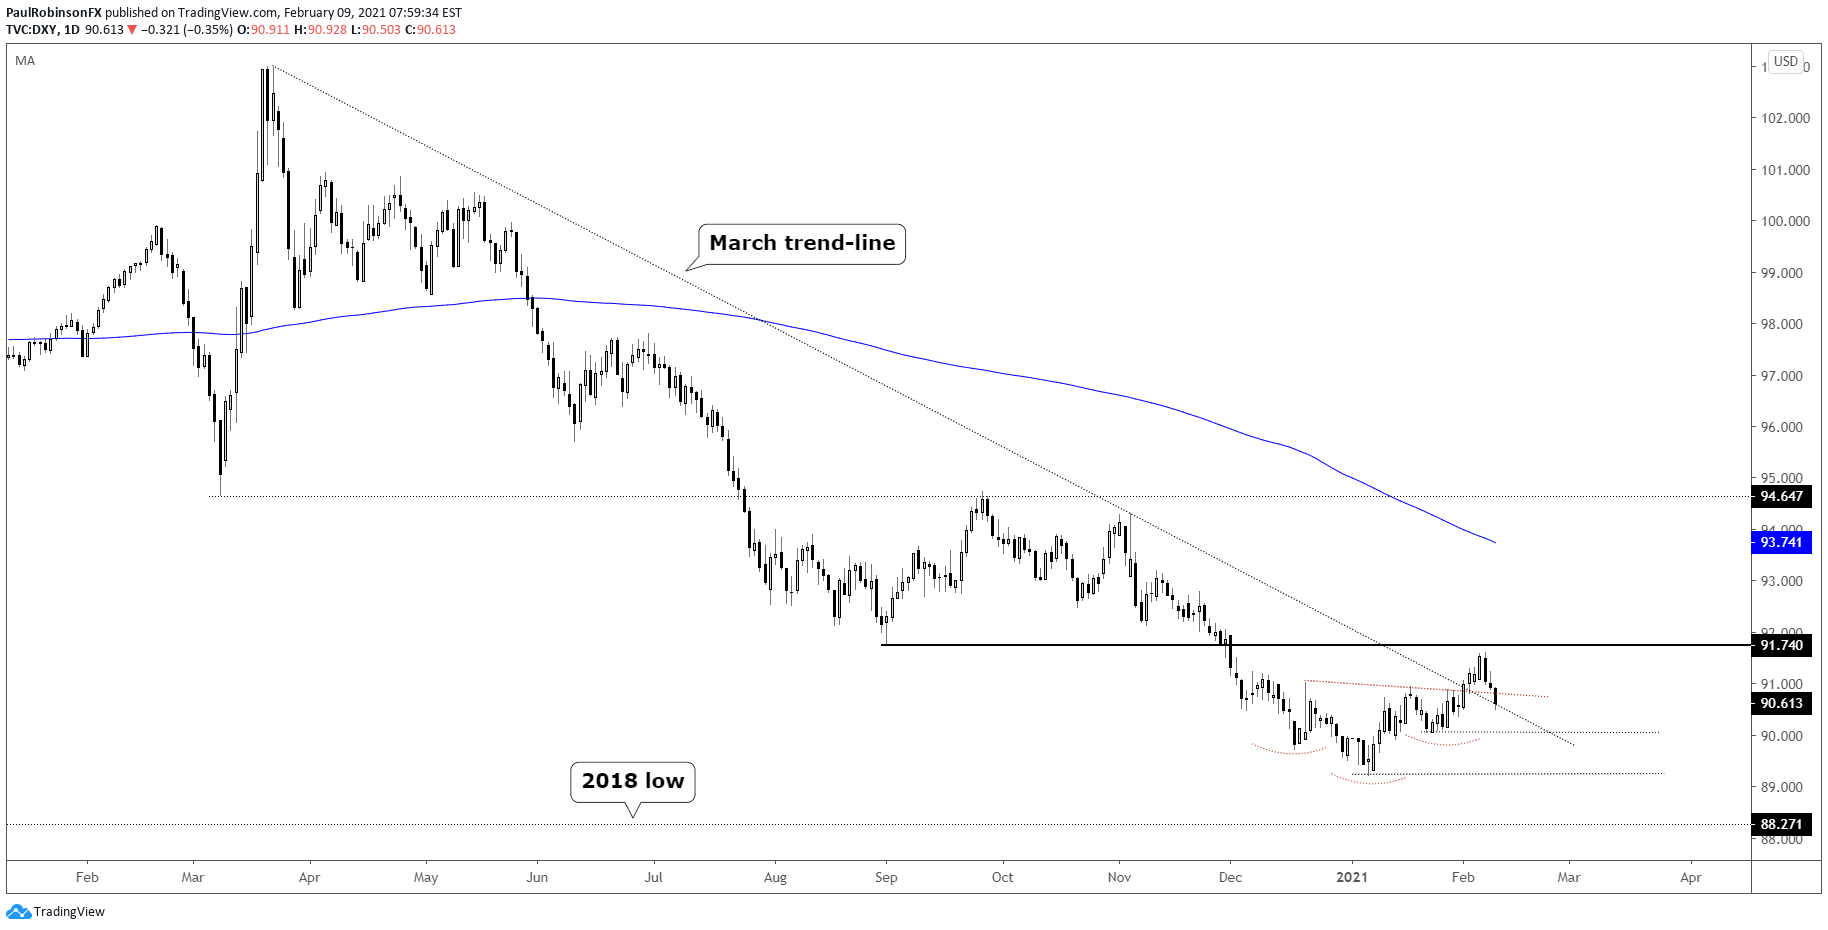
Last week, the US Dollar Index (DXY) broke out of an inverse head-and-shoulders pattern, along with crossing the March trend-line. This had a reversal shaping up until the index reversed just shy of the September low.
Are the past few days the beginning of a meaningful downturn or just a pullback?
This is hard to say just yet, but there are a couple of lines and levels to watch to help give us further cues as to how things might play out.
At the moment the DXY is testing the previously broken March trend-line and if it reverses today to close higher, then the March trend-line will have held and the neckline of the inverse head-and-shoulders, while temporarily breached, will have held on a daily closing basis.
But things do need to turn around quickly here else the risk of a trend continuation from March becomes a real threat. For the inverse H&S pattern to be fully invalidated a decline will need to unfold below the right shoulder at 90.05.
A breakdown below the right shoulder will elevate the risk significantly that price is on its way to the January low of 89.21, and possibly lower. The low in 2018 at 88.27 would become the target on a breakdown below the Jan low.
Keep an eye on the Euro as it is 57.6% of the DXY’s weighting. It is still in a downtrend from January, but a break above 12189 would likely coincide with the DXY neckline breaking.

US Dollar Index (DXY) Daily Chart (Testing trend-line, H&S pattern)
Resources for Forex Traders
Whether you are a new or experienced trader, we have several resources available to help you; indicator for tracking trader sentiment, quarterly trading forecasts, analytical and educational webinars held daily, trading guides to help you improve trading performance, and one specifically for those who are new to forex.
---Written by Paul Robinson, Market Analyst
You can follow Paul on Twitter at @PaulRobinsonFX


