


Euro vs US Dollar Technical Outlook
- The safe-haven linked the US Dollar weakened despite the global increase in Coronavirus infections
- Reversal signals on the US Dollar index (DXY) price chart await the charge
US Dollar Index – Edged Lower
Last week, the US dollar index hit a five-week low of 96.71. Ultimately, the market closed the weekly candlestick modestly in the red with a 0.6% loss.
Traders appeared to invest in riskier assets amid positive news about a coronavirus vaccine. Despite rising cases of the COVID-19 in the US, the market mood has remained upbeat, denting safe haven-linked US dollar.
US Dollar Index DAILY PRICE CHART (Feb 9, 2019 – JuLY 24, 2020) Zoomed Out


US Dollar Index DAILY PRICE CHART (May 21 – JuLY 24, 2020) Zoomed IN
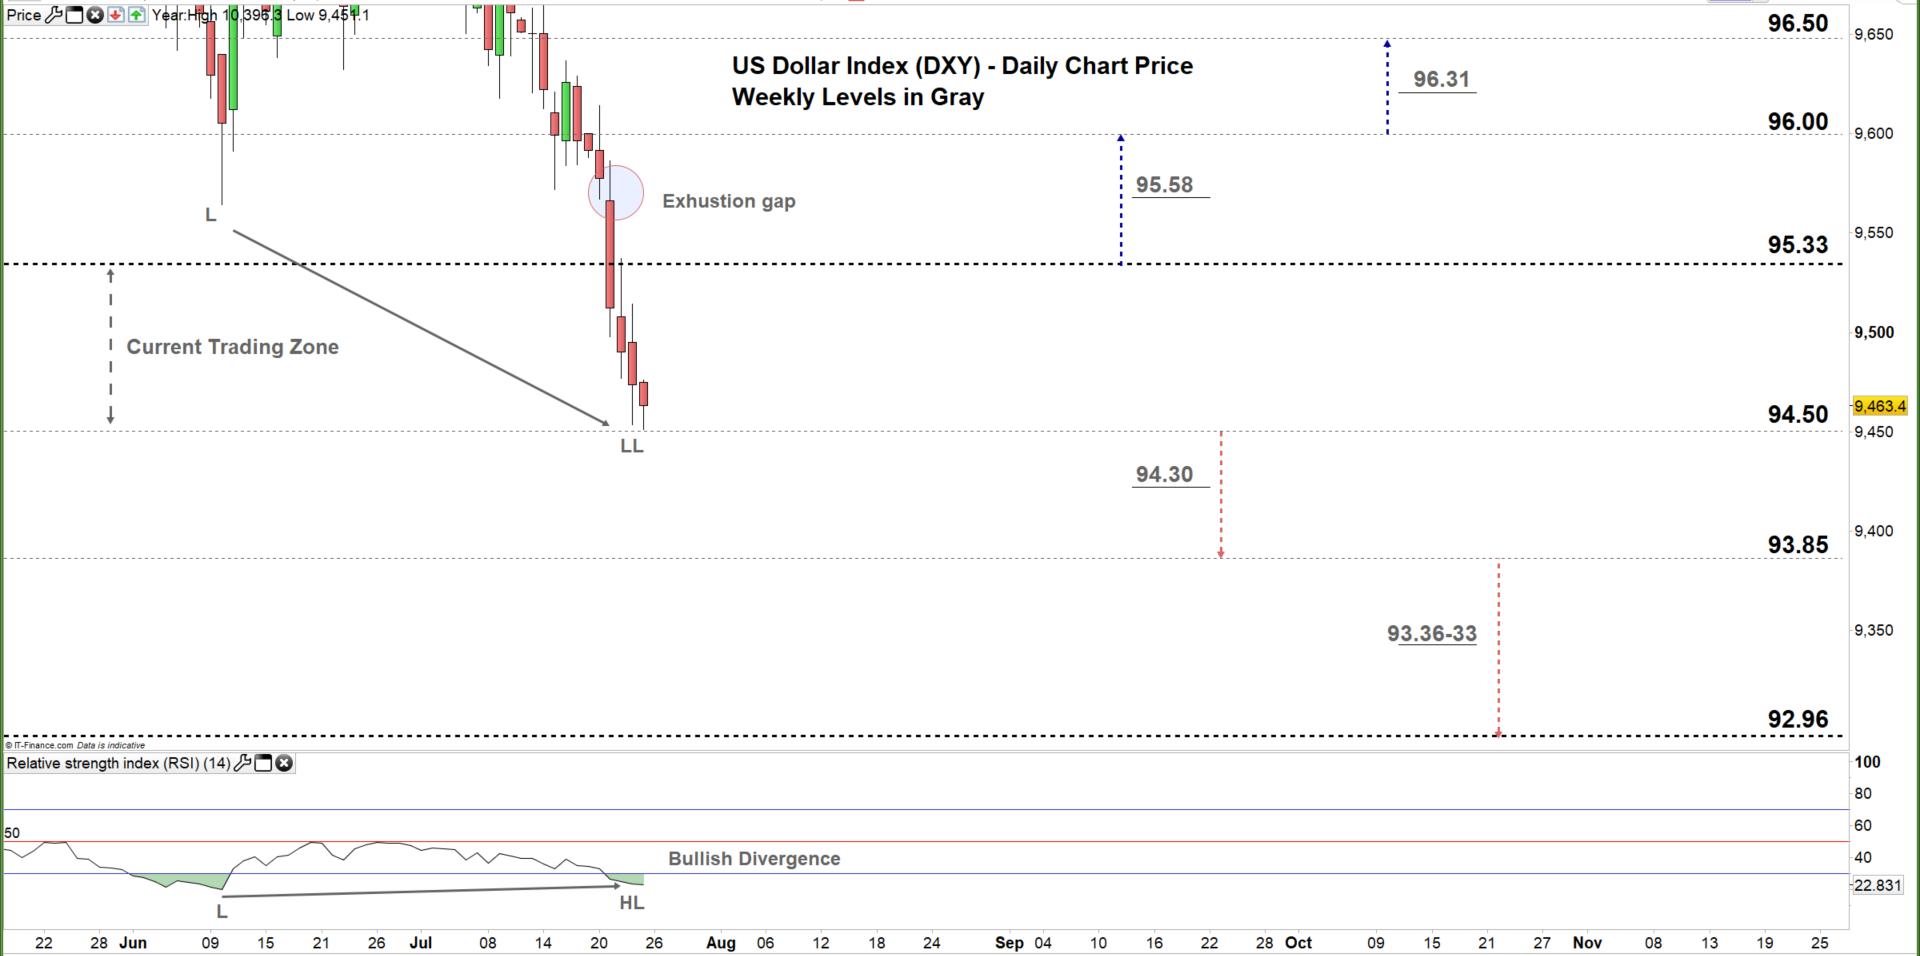
On Tuesday, the US dollar index opened with an exhaustion gap indicating that bearish momentum may run out of steam. The price declined to the current 94.50 – 95.33 trading zone and today the index has tested the low end of the zone.
However, it’s important to note the price and RSI divergence as the former created a lower low, while the latter created a higher low, signaling a possible reversal of the downward trend.
A daily close below the low end of the current trading zone may cause a further slide towards the Dec 2017 high at 93.85.
On the flip-side, a failure to close below the low end of the zone may start a rally towards the high end of the zone.

US Dollar Index Four-Hour PRICE CHART (May 29 – JuLY 24, 2020)

This week, the US Dollar index accelerated its bearish momentum and created a steeper downside slopping trendline resistance originated from the July 21 high at 95.86. That said, a break above this trend line resistance may shift the underlying bias of the market.
To conclude, this week the pair resumed bearish price action, although the exhaustion gap signal combined with the price/RSI divergence provide a good base of a possible reversal. Therefore, a break below the Oct -2018 low at 94.30 could send the US Dollar index towards 93.91, while a break above 94.90 may trigger a rally towards the high end of the current trading zone at 95.33. As such, the support and resistance levels underscored on the four-hour chart should be kept in focus.
Written By: Mahmoud Alkudsi, Market Analyst
Please feel free to contact me on Twitter: @Malkudsi


