


US Dollar Index (DXY) Key Points:
- The ONE Thing: The approach to 95 on the chart aligns with the long-term resistance of the 200-Week Moving Average and Ichimoku Cloud on the weekly chart. Long-term resistance on long-term charts can help traders get a broad context for what is happening in the market. Additionally, a break above long-term resistance can show a broad shift in market sentiment that could be worth your attention in identifying new trends worth following and not fighting.
- As the Trade War rages, the US Dollar appears to be the default currency as the US Economy continues to outperform other economies as evidenced by the Federal Reserve holding a more hawkish view where they raise rates to tame possible inflation as other central banks remain in the offensive mode to stoke inflation.
- Technical Outlook on the US Dollar: The bears in the US Dollar Index (DXY) have few legs to stand on while bullish arguments continue to compile. Whether looking through the lens of Ichimoku, Elliott Wave, Andrew’s Pitchfork, or MACD (there are more) the prudent approach seems to favor further US Dollar Index gains.
Can US Dollar Strength Continue?
In a trek through the FX world, you will see few currencies are holding gains against the US Dollar. The currencies that continue to outperform the US Dollar look to trade in a corrective pattern. The corrective pattern is Elliott Wave-speak for against trend moves.
The one currency I have in mind is the USD/MXN, which has retraced after significant weakness leading up to the AMLO election. However, other or most currencies have not fared so well.
Look to the USDCNY, and you continue to see the trade war (er, disputes) continue to breed CNY weakness while the landscape for further US economic outperformance seems firm. Recent US data has been strong and financial conditions remain easy while US saving rates are strong and banks are set to use over 100% of their net income to pay dividends and buy back stock. Not necessarily an argument for impending doom and gloom on the back of negotiating tactics of the current administration.
Unlock our Q3 forecast to learn what will drive trends for the US Dollar through 2018!
Technically Speaking – US Dollar Meets Long-Term Resistance
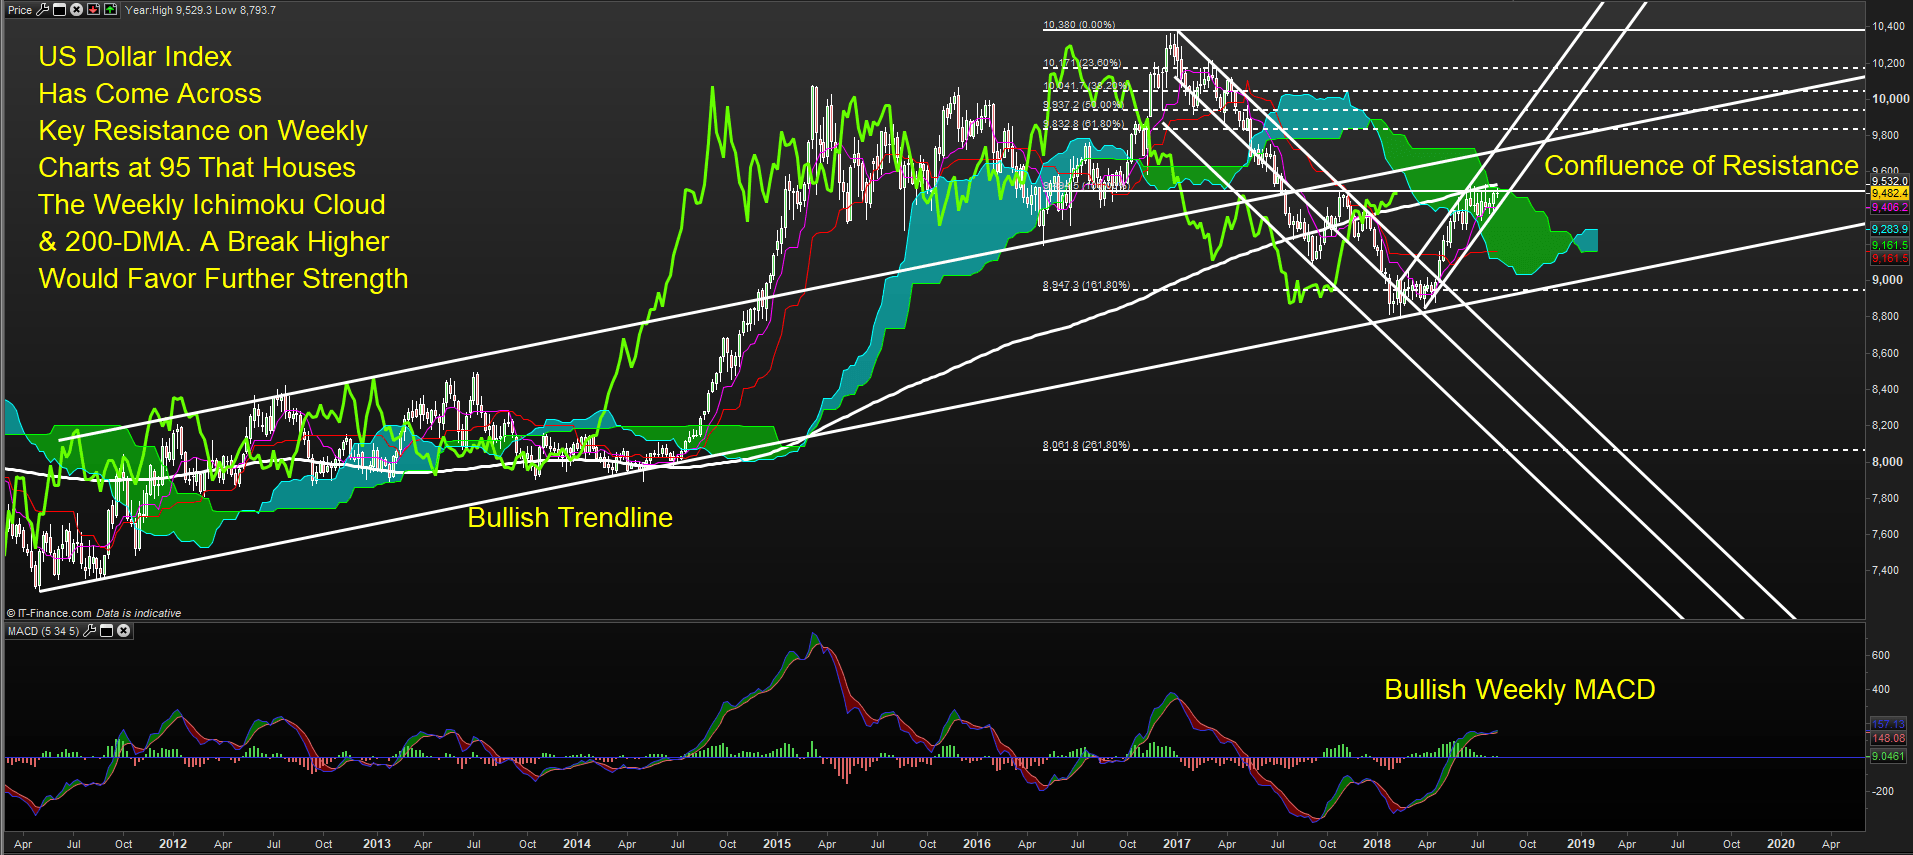
Chart Source: Pro Real Time with IG UK Price Feed. Created by Tyler Yell, CMT
Yikes. That’s a busy chart. Let’s break it down.
From the starting point at the left of the chart, you can see we’re in a seven-year uptrend that began in 2011. We saw a sharp spike in H2 2014 that saw a higher high in January 2017 before appearing to base in Q1 2018.
The question that I’d love answered (as it’d increase the probability of future FX trades) is whether or not the US Dollar will break through the resistance level of 95 that includes the weekly Ichimoku Cloud & the 200-week moving average.
There are a few technical developments that have me favoring a continuation through resistance at 95. First, the MACD is showing a bullish reading. This, in and of itself is not fully sufficient, so I also like that Fibonacci level that price bounced off at the 161.8% expansion at 89.47. The sharp move off this level, earlier this year tends to be the genesis of a new trend.
If the price breaks strongly above 95, and then 95 is eventually tested/ treated as support, then I would be confident in saying we’re likely to move toward the January 2017 high before we break below the 2018 low.
A break below 91.60 would make me think that 95 may have been the highest price we’ll see for some time, but for now, this is a secondary/ non-primary view.
New to FX trading? No worries, we created this guide just for you.
MORE SUPPORT FOR YOUR TRADING:
Are you looking for longer-term analysis on the U.S. Dollar? Our DailyFX Forecasts for Q3 have a section for each major currency, and we also offer an excess of resources on USD-pairs such as EUR/USD, GBP/USD, USD/JPY, AUD/USD. Traders can also stay up with near-term positioning via our popular and free IG Client Sentiment Indicator.
---Written by Tyler Yell, CMT
Tyler Yell is a Chartered Market Technician. Tyler provides Technical analysis that is powered by fundamental factors on key markets as well as t1rading educational resources. Read more of Tyler’s Technical reports via his bio page.
Communicate with Tyler and have your shout below by posting in the comments area. Feel free to include your market views as well.
Discuss this market with Tyler in the live webinar, FX Closing Bell, Weekdays Monday-Thursday at 3 pm ET.
Talk markets on twitter @ForexYell
https://www.dailyfx.com/forex/fundamental/article/special_report/2018/07/28/Effects-of-the-Trade-War-Two-Key-Markets-Being-Hit-the-Hardest-.html


