


US Dollar Index (DXY) Talking Points:
- US Dollar Index Technical Analysis: DXY now targets 61.8% Fib of Nov-Feb range at 92.26
- US Dollar rises to a fresh 3-month high while UST 10Yr yields clear 3% for the first time since Jan. ‘14
- Trader Sentiment Highlight from IG UK: jump in EUR/USD bullish bias favors ST downside
The US Dollar tends to be driven by relative economic growth. As the global reserve currency, when the rest of the world is strengthening, often at a faster pace than the US Economy, it is common for bonds to be issued in US Dollars and then converted to invest abroad driving the US Dollar lower. Another way to see this phenomenon in action is to look at junk bond yields. A falling yield in the US Junk Bond index tends to show a force behind US Dollar weakness whereas rising junk yields tend to favor repatriation and USD strength.
Key Driver In USD Weakness Lets Up As UST Yields Punch Above 3%

Data source: Bloomberg
Recently, the bid in junk bonds had been so intense that the spread between yields on investment-grade and junk-rated debt was the narrowest since 2007 showing a preference to chase yield over creditworthy borrowers. Again, this drive was sending bonds that were issued in USD abroad and done so by selling USD.
However, the tide may be turning as yield spreads are widening thanks in large part to the rising yields that precisely places pressure from borrowers to service debt with the rising benchmark US 10-year yield above 3%. A hold above 3% could send money back to the US or at least, slow money down form moving abroad at the USD’s expense.
Naturally, this aligns with the likely unwind of a key market in the world’s favorite trade over the last five quarters of shorting the US Dollar and going long mega-cap tech or the FAANG-BAT stocks. FAANG-BAT is a complex comprised of US tech firms of Facebook, Amazon, Apple, Netflix, and Google parent Alphabet and has brought in China’s Baidu, Alibaba and Tencent. A look at recent institutional positions shows likely pain for the US Dollar short trade with the largest aggregate short position in five years and the FAANG-BAT group has also lost more than $200B in market cap over the last 5-days.
Looking to the options market, traders are pricing in higher volatility around the US Dollar over a two-week tenor that included the May 02 FOMC rate decision and April’s NFP release. Currently, the market is pricing in a nearly one-in-three chance of a hike on May 02 with a greater than 92% chance for the June 13 meeting.
Unlock our Q2 forecast to learn what will drive trends for the US Dollar through 2018!
Technical Focus on US Dollar Index: Is This Time Different?
For now, it looks like the short answer is yes. Whether you look at institutional positioning per the CFTC, retail positioning via IG Client Sentiment, or the technical levels that have been broken traders should prepare for more bleeding in the US Dollar short trade.
DXY Technical Update – Daily Chart Shows Breakout with Sights On 92.26
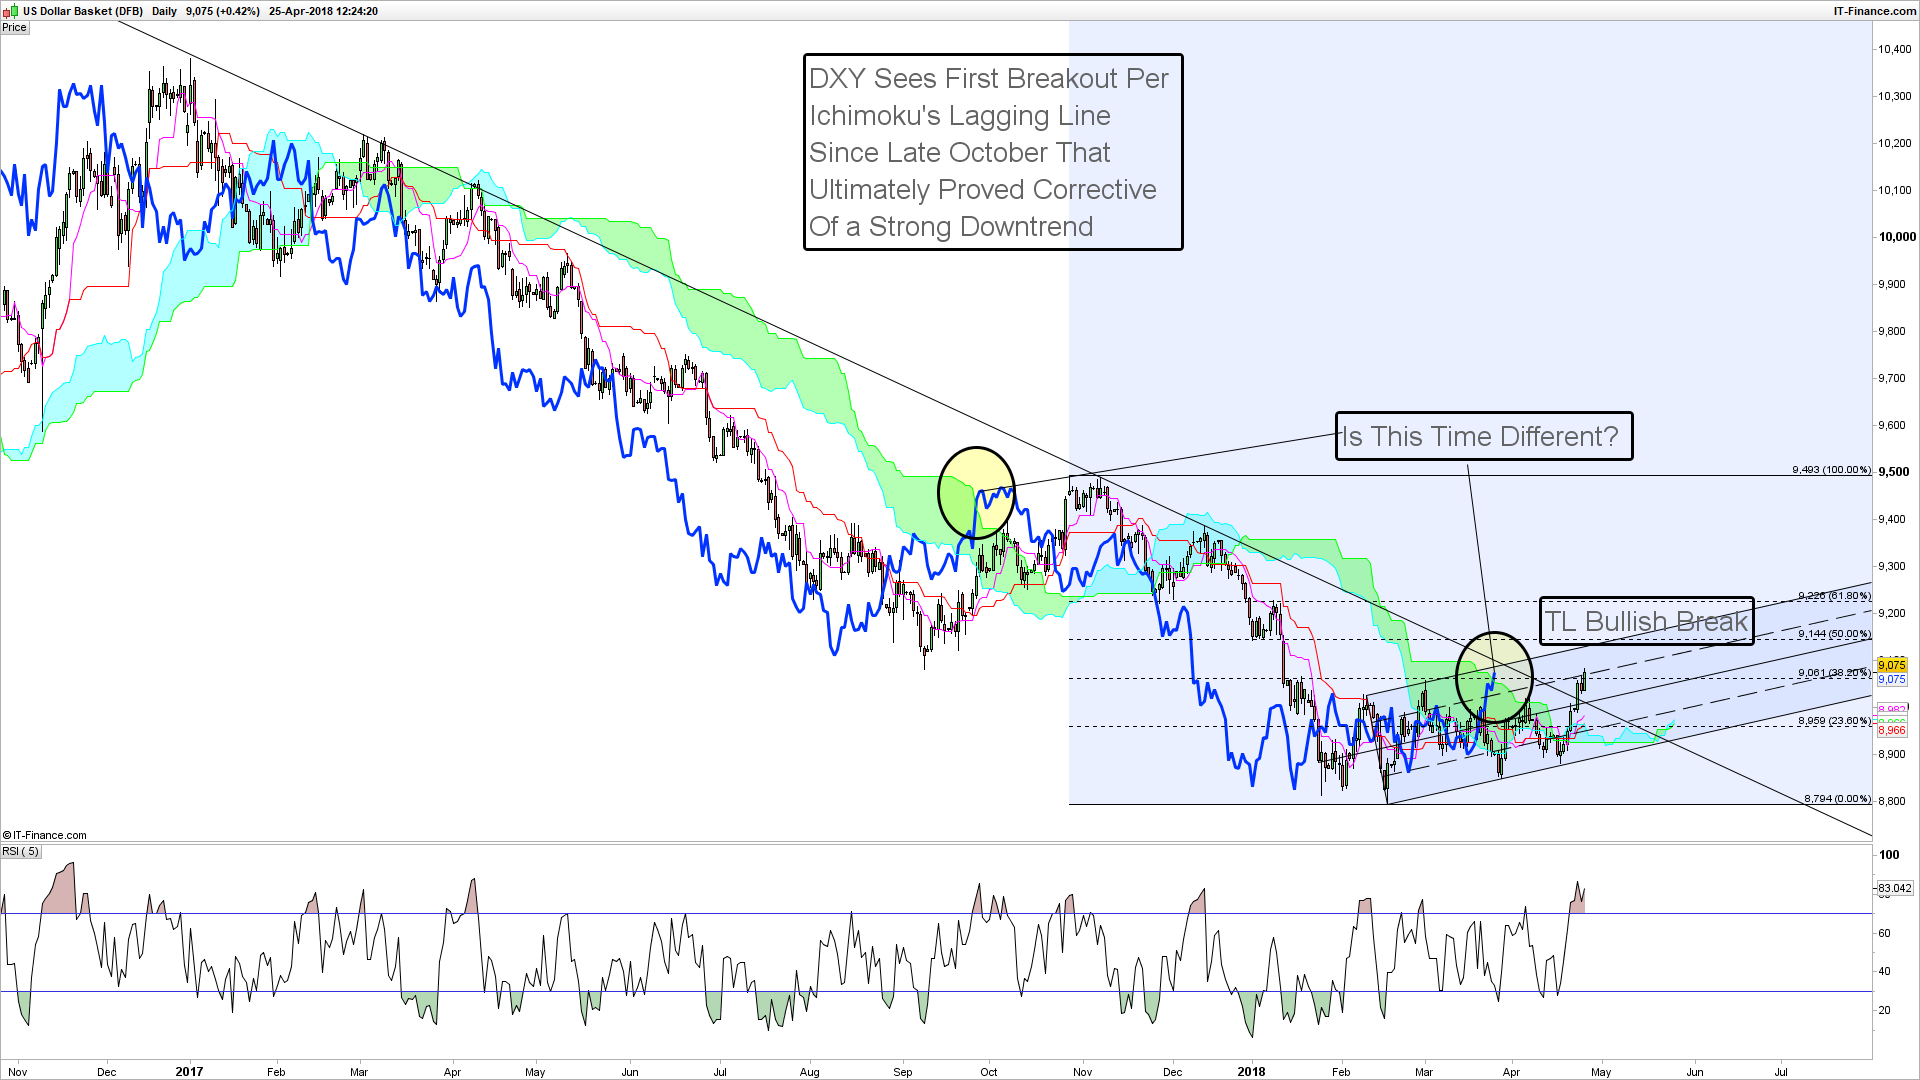
Chart Source: Pro Real Time with IG UK Price Feed. Created by Tyler Yell, CMT
The chart above shows a legitimate breakout on the Daily DXY chart. Now, the technical focus is on the 61.8% retracement of the November-February range at 92.26. A break above 92.26 would favor this move as being distinctly different from the late October Ichimoku breakout that lasted but two weeks before turning over.
The Ichimoku cloud sits at 89.50, and opening a short position above this level is likely premature given the broad unwind that could support the US Dollar heavily over the coming weeks.
Recommended Reading: 4 Effective Trading Indicators Every Trader Should Know
Insight from IG Client Positioning: Traders are Net-Short Suggesting EURUSD May Rise
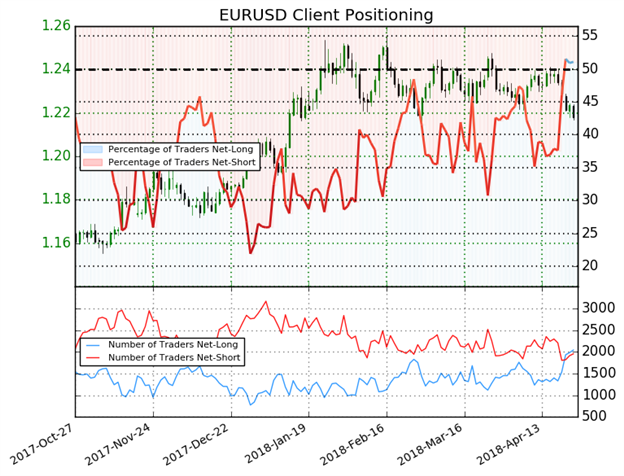
EUR/USD sentiment is analyzed for insight since EUR/USD makes up 57.6% of DXY.
Retail trader data shows 51.1% of traders are net-long with the ratio of traders long to short at 1.04 to 1. The number of traders net-long is 2.7% lower than yesterday and 40.9% higher from last week, while the number of traders net-short is 2.1% lower than yesterday and 16.6% lower from last week.
We typically take a contrarian view to crowd sentiment, and the fact traders are net-long suggests EURUSD prices may continue to fall. Positioning is less net-long than yesterday but more net-long from last week. The combination of current sentiment and recent changes gives us a further mixed EURUSD trading bias (emphasis mine.)
New to FX trading? No worries, we created this guide just for you.
---Written by Tyler Yell, CMT
Tyler Yell is a Chartered Market Technician. Tyler provides Technical analysis that is powered by fundamental factors on key markets as well as t1rading educational resources. Read more of Tyler’s Technical reports via his bio page.
Communicate with Tyler and have your shout below by posting in the comments area. Feel free to include your market views as well.
Discuss this market with Tyler in the live webinar, FX Closing Bell, Weekdays Monday-Thursday at 3 pm ET.
Talk markets on twitter @ForexYell
Join Tyler’s distribution list.


