


Talking Points:
-Dollar Technical Strategy: watching rebound after sixth straight week of new price lows
-Previous Post: Dollar Technical Analysis: Next Dollar Breakdown Could Travel
-If you’re looking for trading ideas, check out our Trading Guides
Given the six straight weeks of lower lows in the DXY that began in late December, a bounce was anticipated as the early movers on the drop in DXY were anticipated to begin taking profits. However, what remains to be seen is the sustainability of the bounce.
If you look at the chart above, you’ll notice three key zones of support that roughly held, which prevented the DXY from continuing its downtrend, at least for now. The three keys components that provided support were the Ichimoku Cloud base on the Daily Chart, which is comprised of the 50% retracement over the last 52 data periods. While price did break below the cloud technically, we did not see the lagging line (bright green) break into the cloud, and we did not see a strong move lower once price pierced the cloud, but rather price moved sideways before beginning this week’s retracement.
An eventual break below last week’s low of 99.23, followed by a lagging line move into and through the Ichimoku Cloud would be the clearest Ichimoku sign of a larger breakdown developing in DXY.
The second component that we’ve long been watching is Andrew’s Pitchfork drawn from a closing low of a momentum spike on June 3 as well as two pivots in July and August. You can see how the bottom of the PF channel has provided strong support throughout the move higher. In addition to watching for the price breaking below the Ichimoku Cloud, a move of the price below the AP channel would be indicative of a larger change in sentiment and trader behavior that favors further selling over buying taking place.
The last structural component that impressively held on the DXY was the October 25 high that is highlighted with a yellow rectangle. From an Elliott Wave perspective, a hold of this zone would favor the view, as long as the price moves higher from here, that a deep retracement occurred, but nothing that damaged the bullish structure of the trend, which is seen with wave overlap.
Thus, a hold at last week’s low would be akin to Winston Churchill’s comment that, ”Nothing in life is so exhilarating as to be shot at without result.” In other words, the Bulls were pinned against the corner, but as long as they hold last week’s low, there could be life and much further upside for the Bull’s yet. Naturally, a break below the 99.12/43 zone we’ve highlighted would resume the focus lower.
A zone of resistance to watch on the bounce would also be the 38.2-61.8% retracement region of the 2017 move, which is housed at 100.99-102.07. The wost case for Bulls (best case for Bears) would be a move to this zone that pivots and breaks above the zone above. A break above the Fibonacci zone could be indicative that we've seen the low in the USD for a while.
Interested in Joining Our Analysts, Instructors, or Strategists For a Free Webinar? Register Here
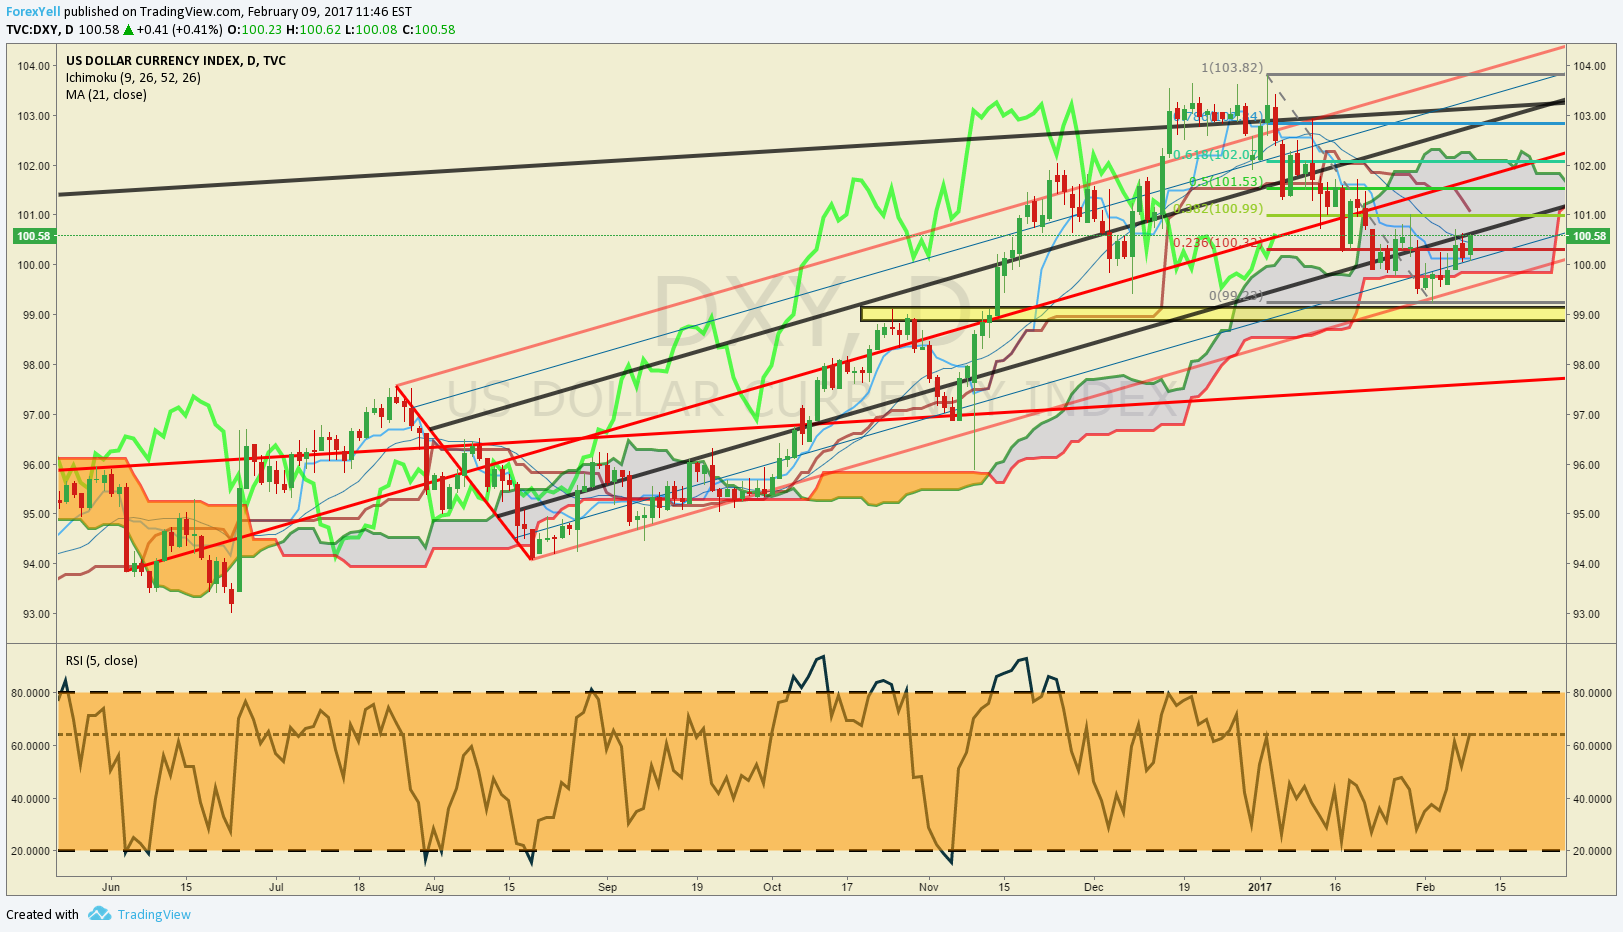
Chart created by Tyler Yell, CMT
---
Shorter-Term DXY Technical Levels for Thursday, February 9, 2017
For those interested in shorter-term levels of focus than the ones above, these levels signal important potential pivot levels over the next 48-hours of trading.

T.Y.


