


Talking Points:
-Dollar Technical Strategy: remaining doubtful of immediate upside potential below 102.95
-Prior Post: Dollar Technical Analysis: DXY Sitting At Trend Support
-If you’re looking for trading ideas, check out our Trading Guides
The US Dollar has taken a surprising step back as many anticipated the strong move that ended 2016 would carry through in early 2017. However, we have since seen a pull-back that is worth watching as a deeper setback could cause many of the long positions to bail out on the trade, which could have the effect of removing short-term support for USD.
This pullback in early 2017 does not mean that there is not still encouraging upside for USD over the medium- and long-term vs. other weak currencies like the British Pound, but short term caution remains warranted. The Dollar Index remains out of short-term favor in the second week of trading for 2017 as shown by the price trading at new lows for 2017, and even breaking below the December 14 low when the Federal Reserve raised interest rates by 25bps and increased the median dot plot by 25bps. A key theme we’ve been watching that has provided a leading indication of currency strength and weakness has been sovereign yield spreads, which has narrowed recently at UST 2yr yields fall from ~130bps to near ~115bps. The breakdown has led the USD lower.
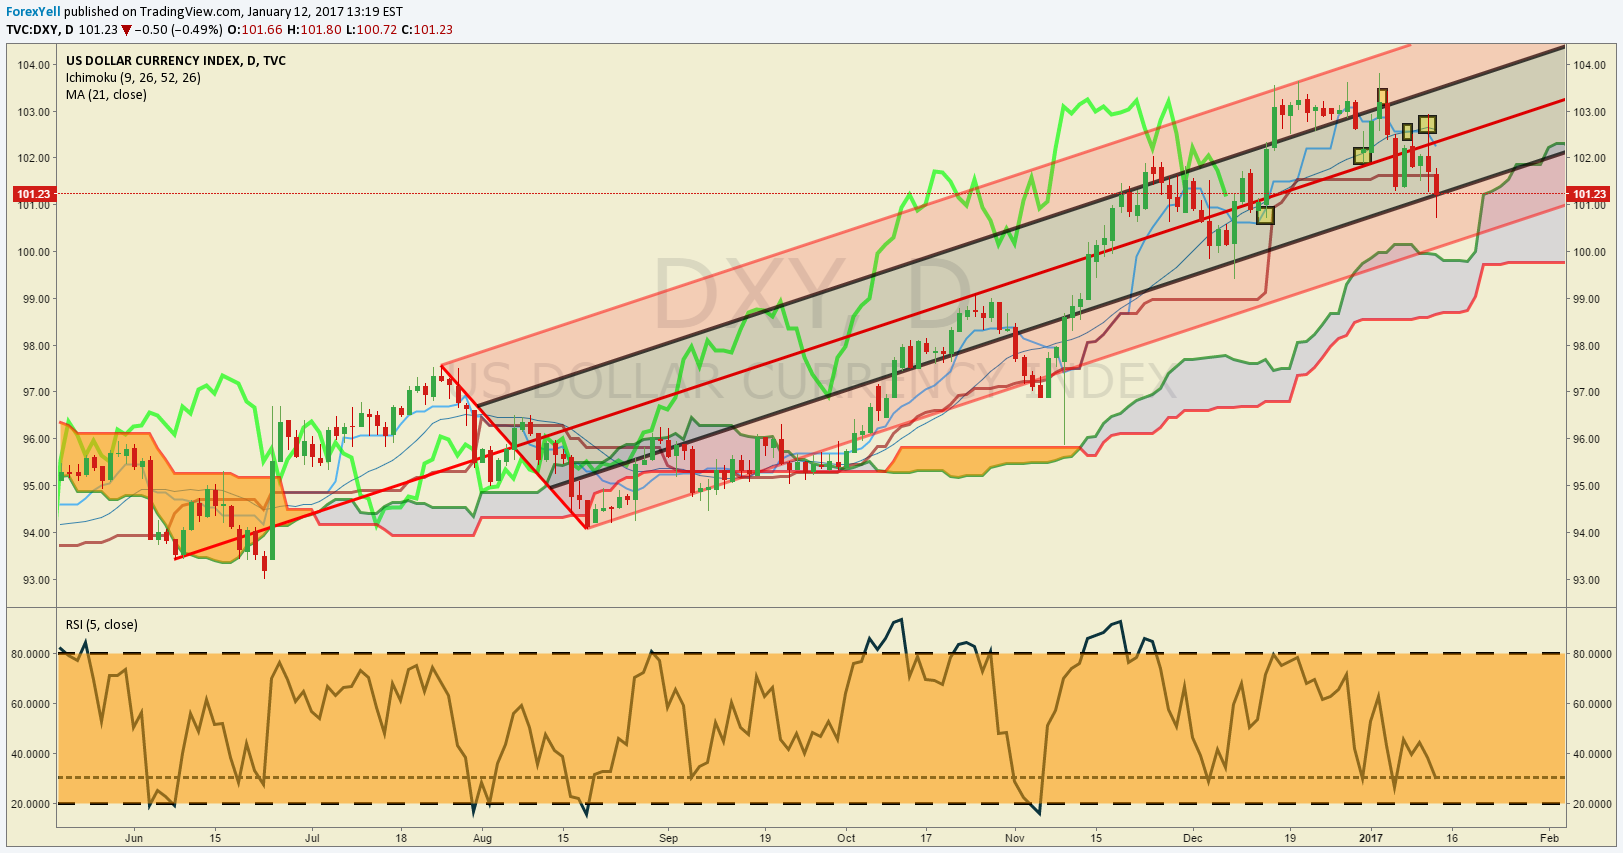
DXY trading between the second half of Q3 2016 to today has remained well within the price channel on the chart below drawn with Andrew’s Pitchfork. The handle is drawn off an extreme momentum low in early June. You can also see that the late December price action rubbed against the top of the channel before breaking down, which now turns our attention to the bottom of the rising channel near 100.00/50 to see if we get a strong bounce. If we do, we can assume that the strong trend in USD is resuming.
However, if we fail to move higher off the channel support, there could soon be a strong break below the December low of 99.43. It would have been difficult to imagine questioning the uptrend a few weeks ago, but we find ourselves asking if the market went “too far, too fast.” For now, we’ll anticipate a bounce, and trend resumption given the divergence between Central Banks. The bounce view would be validated on a move through the 102.95 high on Wednesday.
Interested in Joining Our Analysts, Instructors, or Strategists For a Free Webinar? Register Here
D1 Chart Shows DXY Sitting At Channel Support, Breakdown from Here Is Worrisome
Shorter-Term DXY Technical Levels for Thursday, January 12, 2017
For those interested in shorter-term levels of focus than the ones above, these levels signal important potential pivot levels over the next 48-hours of trading.

T.Y.


