


FTSE 100 Technical Highlights:
- The FTSE rushed through but reversed to close above big support
- Major horizontal support and trend-line are in confluence

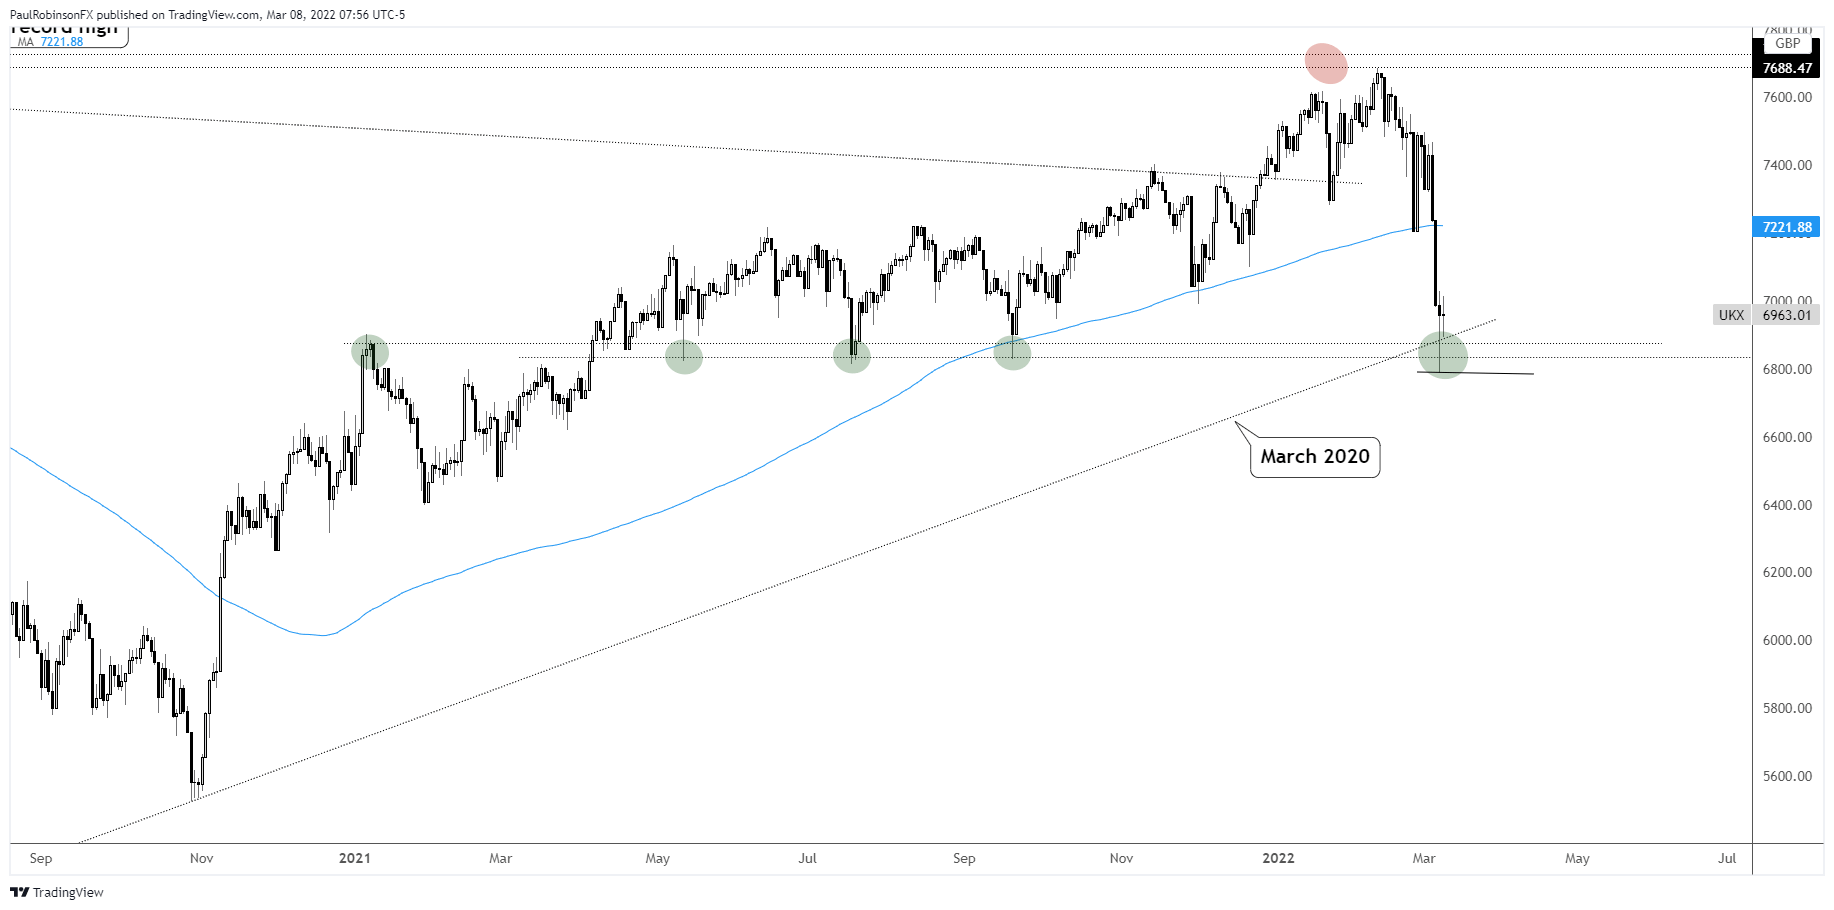
The FTSE 100 has recently fallen with a lot of momentum, but that came to a pause yesterday with a powerful reversal candle forming. The forming of the candle is one thing, but where it occurred at is another.
There is strong confluent support around 6870/6780, created by the rising trend-line off the March 2020 low and several intermediate-term turning points created since a peak created in January 2021. There were three instances of a low within a 10 handle range of one another.
These were carved out in May, July, and September last year. The multiple turning points on this horizontal line give it a lot of weight as a support level the market should respect. Couple it with a trend-line and proper price action, and you have a line-in-the-sand.
Not saying it will hold for a long time, as we have seen given the nature of this market cycle’s catalyst – a highly unpredictable situation – that exhaustion moves can become even more exhausted. But for now as long as Monday’s low at 6787 holds on a closing basis, then the outlook is neutral to bullish.
We may only see a bounce ensue before more selling occurs, hard to say at this juncture how much the market can rally. If we see a close develop below yesterday’s low, then we will need to respect the fact that a big level of support was broken and run with a bearish bias.
FTSE Daily Chart
Resources for Forex Traders
Whether you are a new or experienced trader, we have several resources available to help you; indicator for tracking trader sentiment, quarterly trading forecasts, analytical and educational webinars held daily, trading guides to help you improve trading performance, and one specifically for those who are new to forex.
---Written by Paul Robinson, Market Analyst
You can follow Paul on Twitter at @PaulRobinsonFX


