


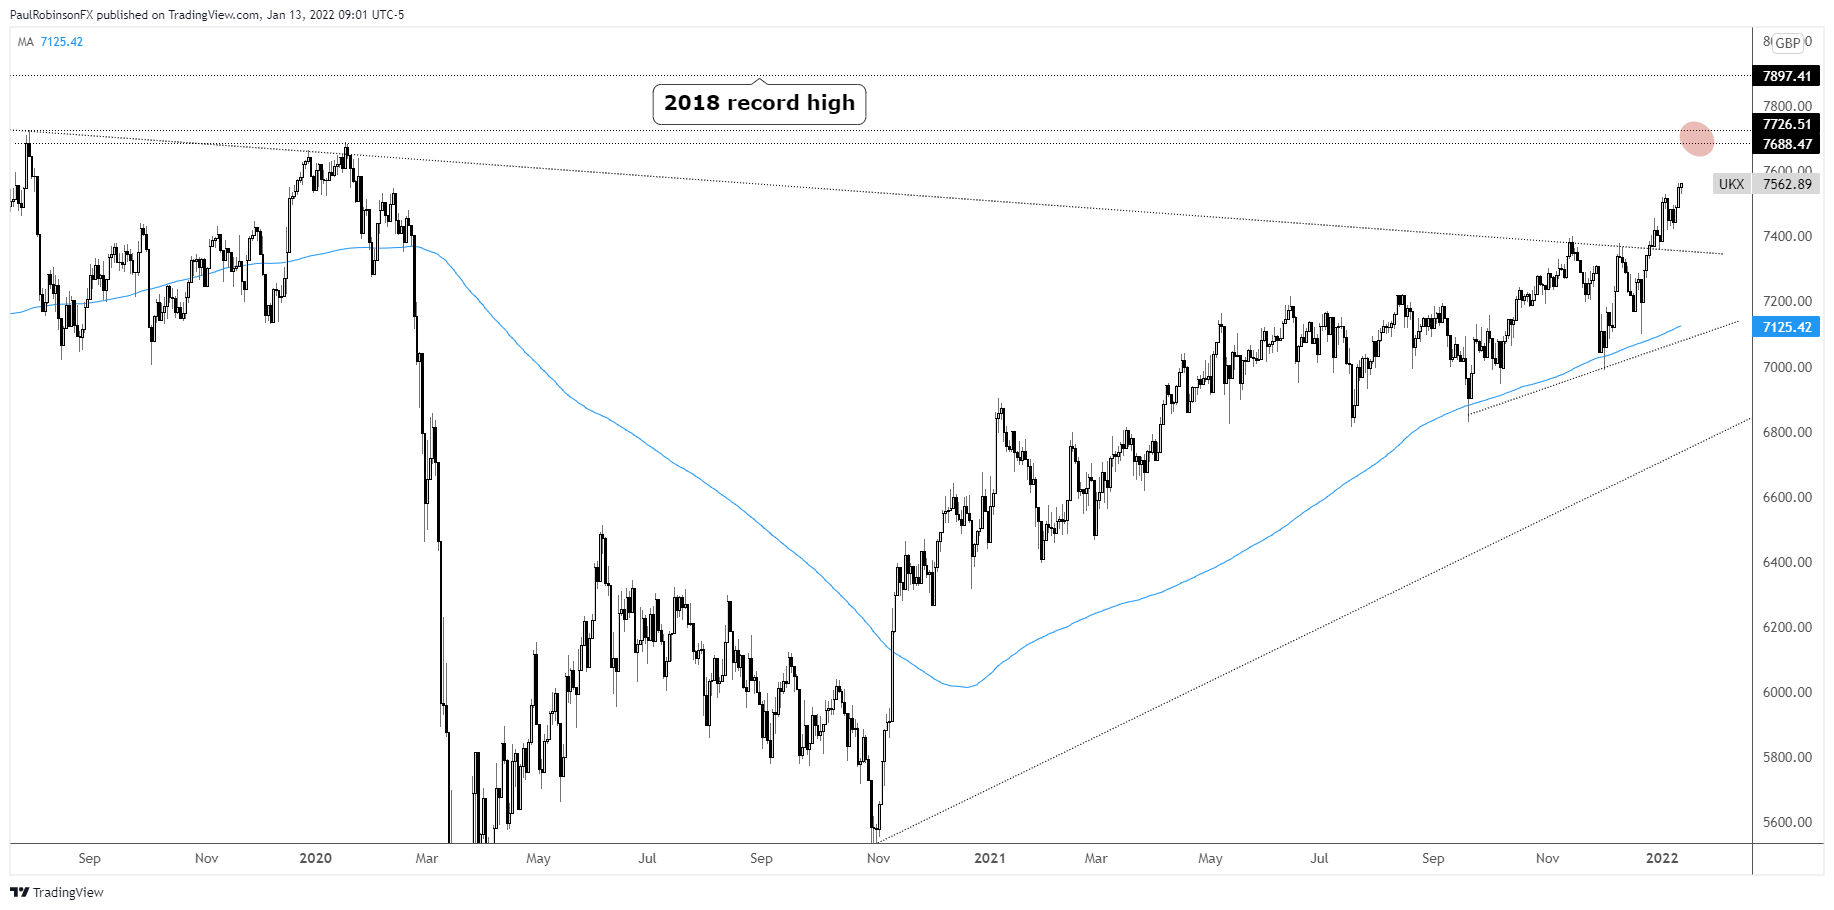
FTSE 100 Technical Highlights:

The FTSE 100 is continuing its strength following a breakout above a barrier of resistance via the trend-line running off the 2018 high. The upward trajectory appears set to continue in the near-term, but big resistance lies not far ahead.
The pre-pandemic highs created in January 2020 at 7689 along with the 2019 high at 7711 makes for a tight zone of resistance that may be difficult to overcome on the first approach. Price action will be key to watch.
A reaction, i.e. a swift reversal day, could be the first indication that a correction will begin. Given the way the FTSE often times trades – three steps forward, two back – it wouldn’t be surprising to see a pullback of a few hundred points before trying to push onward again.
Whether the initial set of resistance levels can be broke on a first test or not, beyond there lies the 2018 record high at 7903. This makes the zone from right around 7700 up to just over 7900 a very important one to pay attention to in the days/weeks ahead.
For now, continuing to run with a bullish bias but that appears likely to be soon put to the test. A corrective move, whether it comes in the form of a pullback or consolidation, could do the FTSE some good for extending into fresh record territory. The preferred strategy is to buy on dips over chasing momentum.
FTSE Daily Chart
Resources for Forex Traders
Whether you are a new or experienced trader, we have several resources available to help you; indicator for tracking trader sentiment, quarterly trading forecasts, analytical and educational webinars held daily, trading guides to help you improve trading performance, and one specifically for those who are new to forex.
---Written by Paul Robinson, Market Analyst
You can follow Paul on Twitter at @PaulRobinsonFX


