FTSE 100 Technical Highlights:
- FTSE still remains with limited directional cues
- Trading bias is lower for now, watch general risk trends
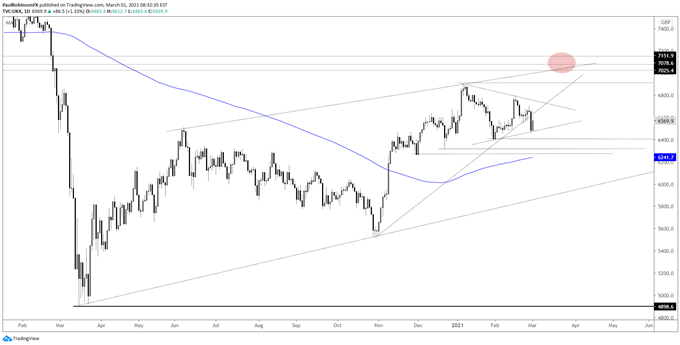
The FTSE 100 has not been an easy handle lately, a theme that is often the case with this index and its choppy price action. But even as such, the trading bias looks somewhat clear in the very near-term. The short-term trend is lower with the breaking of the late October trend-line helping this bias.
This morning’s pop isn’t anticipated to last long and could reverse lower in the early part of this week. As long the FTSE stays below the most recent short-term swing-high at 6702, the index is positioned to trade sideways at best. Looking lower, support clocks in at 6397, the January low.
A break beneath there will have in focus a pair of lows created in December; 6315 and 6263. The 200-day MA is rising up just under that zone, currently at 6214.
Keep an eye on general risk trends, namely the weakening U.S. markets. They are testing important trend support from March of last year, and if they fail to hold up then it is likely to weigh on global stocks as a whole.
If risk trends can stabilize and the FTSE can break above 6702, then it won’t necessarily negate a moderately bearish bias, but it will bring into play more range construction with the possibility of higher prices.
A triangle formation could develop should the range begin to constrict. How that resolves is something we will need to revisit later should the pattern come to fruition.


FTSE Daily Chart (lower but range could constrict)

Resources for Forex Traders
Whether you are a new or experienced trader, we have several resources available to help you; indicator for tracking trader sentiment, quarterly trading forecasts, analytical and educational webinars held daily, trading guides to help you improve trading performance, and one specifically for those who are new to forex.
---Written by Paul Robinson, Market Analyst
You can follow Paul on Twitter at @PaulRobinsonFX


