FTSE 100 Technical Highlights:
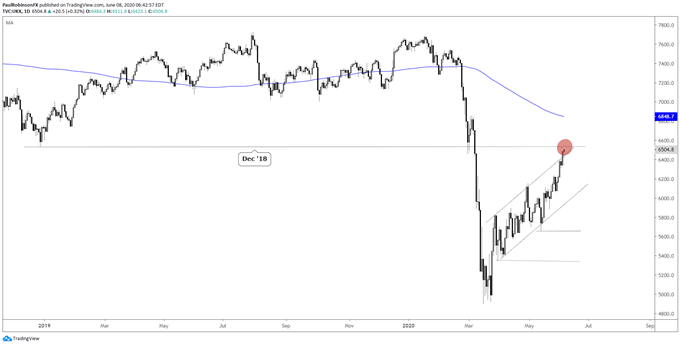
- FTSE rising to 2018 low, bounce zone from March
- Starting to edge outside of bullish channel
- Cautious stance here may be warranted
FTSE rising to 2018 low, bounce zone from March
The FTSE continues its advance off the March low, stringing together a solid run over the past week. Last week we looked at the bullish channel price is contained within, noting that as long as it stays inside, or more specifically above the lower parallel, that the trend is neutral to up.
We are seeing price start to rise out of the top of the channel as it nears an important inflection point, the first level of price resistance the index has encountered since bottoming in March. The December 2018 low was an important one for not only the FTSE, but global stocks as a whole.
It is also around the first significant bounce point that developed following the initial coronavirus blast in late February. This makes the 6536/85 zone an important one to watch as the FTSE tries to string together more gains. A turn off resistance will keep price contained within the channel.
Still to be determined of course whether we would see a meaningful decline or shallow correction from resistance, if one develops at all. It would be a healthy development if another short-term base developed, providing traders a potential opportunity for a continuation entry on new longs.
If price action becomes starkly negative there could be some short opportunities for traders to take advantage of as the trend off the Q1 low gets challenged. In any event, the FTSE is on the verge of testing resistance and helping shape the near-term outlook. It’s possible it runs through as well, in which case the next level up would be the 200-day MA, currently at 6848.


FTSE Daily Chart (December 2018 low)

UK 100 Index Charts by Tradingview
You can join me every Wednesday at 930 GMT for live analysis on equity indices and commodities, and for the remaining roster of live events, check out the webinar calendar.
Tools for Forex Traders
Whether you are a beginning or experienced trader, DailyFX has several resources available to help you; indicator for tracking trader sentiment, quarterly trading forecasts, analytical and educational webinars held daily, trading guides to help you improve trading performance, and one specifically for those who are new to forex.
---Written by Paul Robinson, Market Analyst
You can follow Paul on Twitter at @PaulRobinsonFX


