


FTSE 100 Technical Highlights:
- FTSE found opposition near the September high, channel weakening
- Still potential for big-picture top if a decline begins soon
For our analysts intermediate-term fundamental and technical view on the FTSE and other major indices, check out the Q4 Global Equity Markets Forecast.
FTSE found opposition near the September high, channel weakening
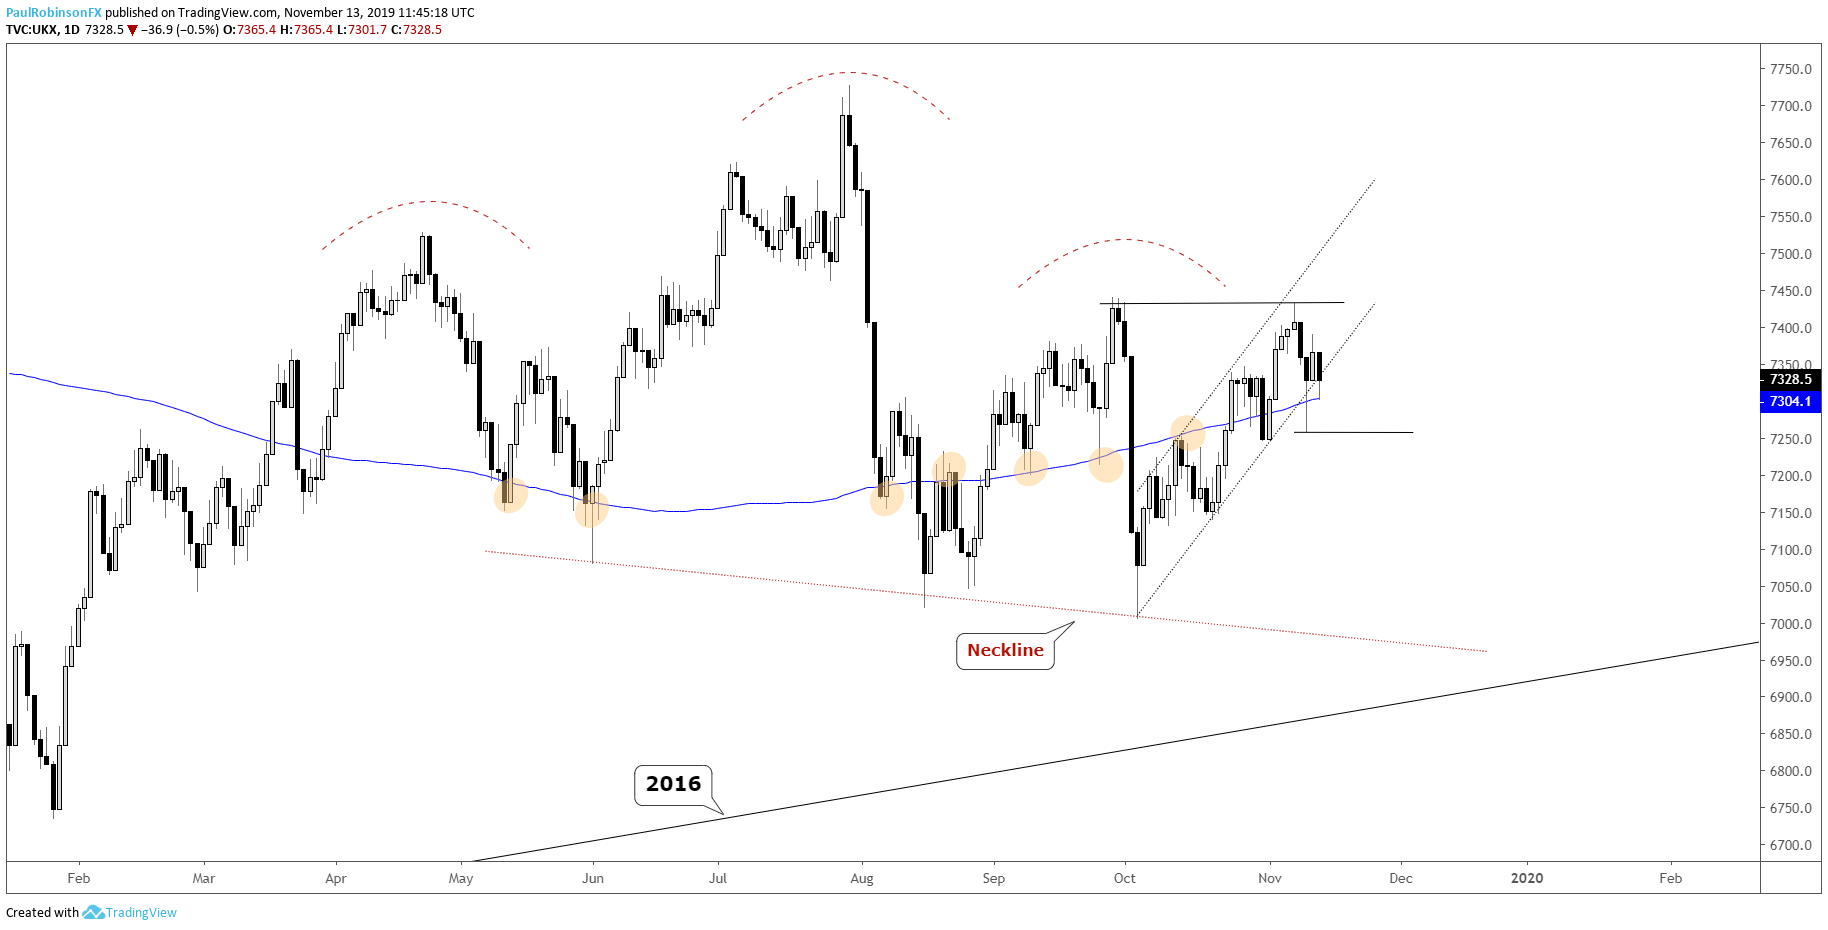
Last week the FTSE traded up very near the September high before rolling over, the area over 7400 is proving to be a resistance zone worthy of attention, it also could be part of large topping pattern that has been building since April.
The head-and-shoulders (H&S) top has not completely formed, of course, until it breaks the neckline that was tested and successfully held last month, down near 7000. A relatively swift turn down form here could put that big-picture scenario back on the map by firming up a complex right shoulder.
But before doing that the market will need to get outside of the channel off the last month’s low. Currently the channel is keeping the market pointed higher in the short-run. Yesterday, the market was breaking the lower parallel of the structure along with the 200-day before recovering into the close.
The generally tepid upward momentum and lagging nature of the FTSE relative to other global indices, sets it up for a fall soon if buyers don’t show up with more conviction. A bearish scenario that is growing teeth. A close below yesterday’s low at 7258 is viewed as a catalyst for further selling.
If the channel continues to keep the market supported, then a climb above the September high at 7440 will need to take place before the H&S pattern can come off the table and momentum can pick up towards the yearly high of 7727.
Check out this guide for 4 ideas on how to Build Confidence in Trading.
FTSE Daily Chart (watch channel, H&S still on the table)
UK 100 Index Charts by Tradingview
You can join me every Wednesday at 1030 GMT for live analysis on equity indices and commodities, and for the remaining roster of live events, check out the webinar calendar.
Tools for Forex & CFD Traders
Whether you are a beginning or experienced trader, DailyFX has several resources available to help you; indicator for tracking trader sentiment, quarterly trading forecasts, analytical and educational webinars held daily, trading guides to help you improve trading performance, and one specifically for those who are new to forex.
---Written by Paul Robinson, Market Analyst
You can follow Paul on Twitter at @PaulRobinsonFX


