


FTSE 100 Technical Highlights:
- FTSE near-term techs are tilted higher
- Topping pattern via an H&S still on the table
For our analysts intermediate-term fundamental and technical view on the FTSE and other major indices, check out the Q3 Global Equity Markets Forecast.
FTSE near-term techs are tilted higher
The FTSE continues to press higher, albeit in an unconvincing fashion. Tuesday brought support via the 200-day MA, which has been actively involved the past few months as a reliable short-term line of support and resistance. Watch for this to continue to be the case in the near-term.
The most recent hold could be considered a right shoulder of an inverse head-and-shoulders (H&S) pattern that is part of a developing bigger picture variation of a traditional H&S formation. Not long ago we ran into a similar sequence with the DAX.
The price sequence isn’t quite as clean, though. The upward move right now also smacks of an ascending wedge out of a low which are considered bearish corrective patterns if triggered, that is if price drops below the lower trend-line of the pattern.
So what are we to do? The neckline of the inverted pattern is currently being tested, so that has yet to officially trigger. If it does then the upside should continue for a bit and the broader H&S pattern may further develop, if one develops at all. Still need a right shoulder to form and then a trigger of the neckline (red dotted line on chart). Some work to be done before that can happen.
Should recent price activity turn out to be a corrective wedge, then that could lead to a short once the 200-day is fully cleared right above 7200. This could provide an early entry on the larger topping formation.
It’s not the clearest picture out there right now, but there are some scenarios to work with. On this end, a little more wait-and-see is preferred before becoming too involved.
Check out this guide for 4 ideas on how to Build Confidence in Trading.
FTSE Daily Chart (price patterns in play)
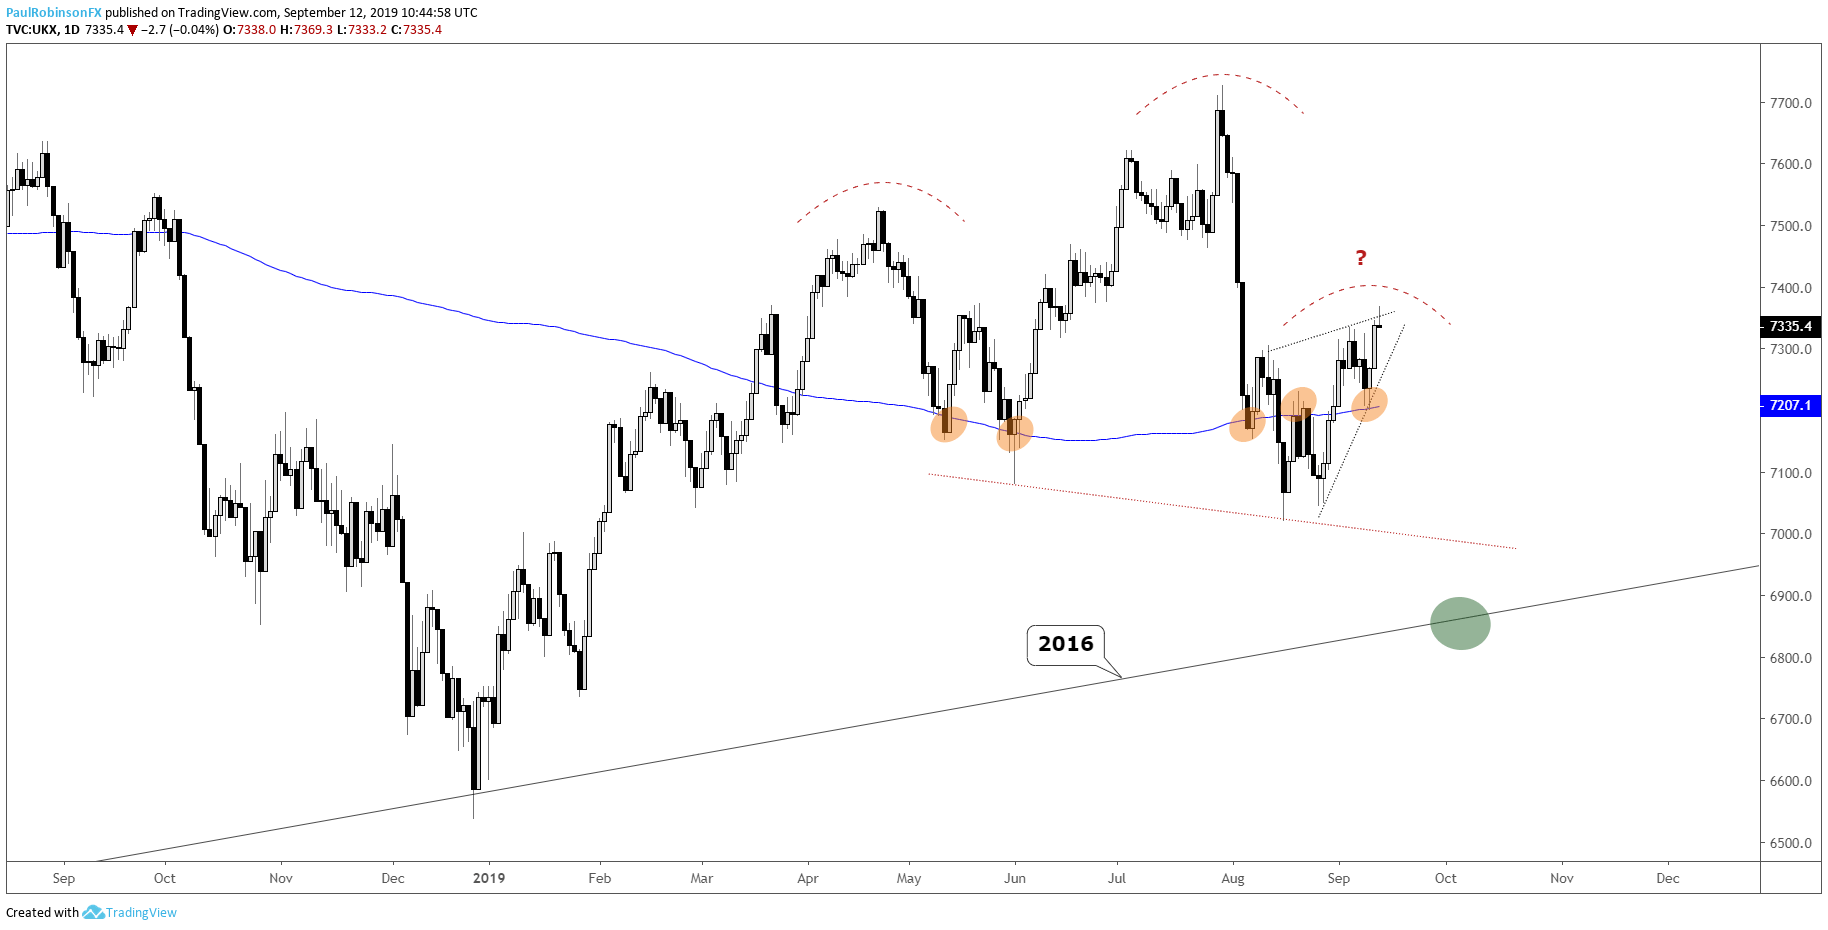
UK 100 Index Charts by Tradingview
You can join me every Wednesday at 930 GMT for live analysis on equity indices and commodities, and for the remaining roster of live events, check out the webinar calendar.
Tools for Forex & CFD Traders
Whether you are a beginning or experienced trader, DailyFX has several resources available to help you; indicator for tracking trader sentiment, quarterly trading forecasts, analytical and educational webinars held daily, trading guides to help you improve trading performance, and one specifically for those who are new to forex.
---Written by Paul Robinson, Market Analyst
You can follow Paul on Twitter at @PaulRobinsonFX


