


FTSE Technical Highlights:
- FTSE rally stopped in its tracks around 7200
- Today’s rally may only be another test before lower
Get your forecasts today for the FTSE and Pound right here on the DailyFX Trading Guides page.
FTSE rally stopped in its tracks around 7200
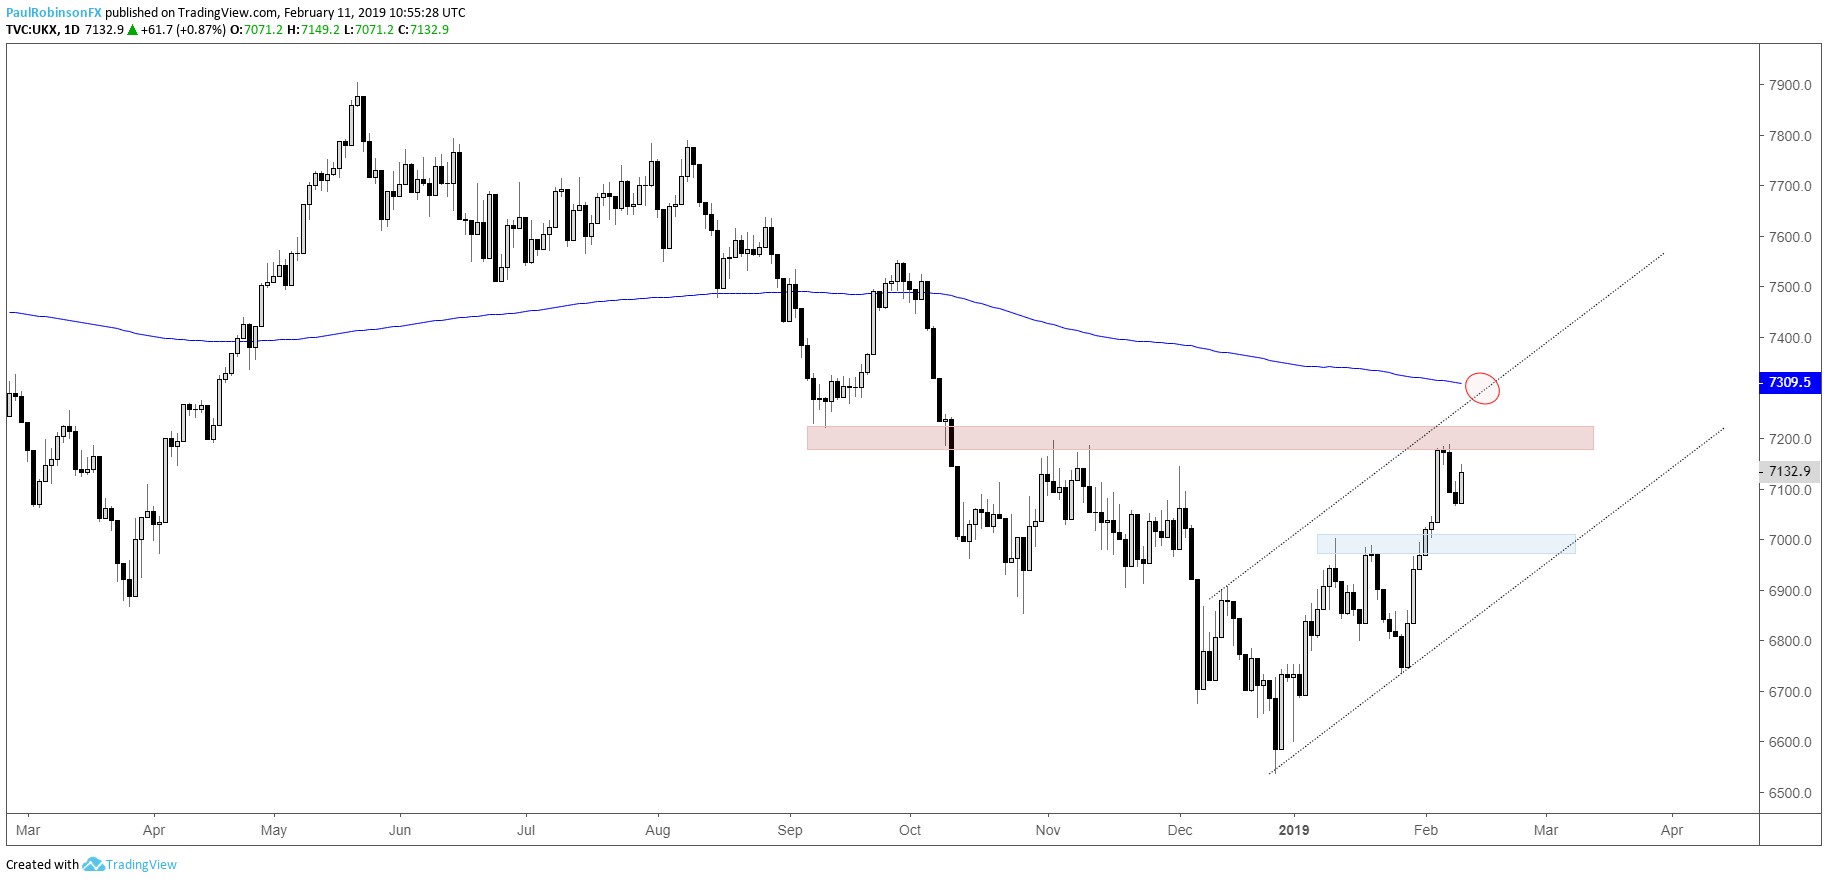
The FTSE’s rally since late last month took it up to the area surrounding 7200, a spot penciled in as potentially being problematic given its significance late last year. The turn down to end last week was the first sign of this actually being the case.
Today’s rally is bringing the FTSE near another test of resistance, but will it break on through? Last week we saw Euro-zone equities weaken materially, Japan is at multi-week lows with only a couple of days of selling, and the U.S. could be just getting started on turning lower.
With the global picture in mind, the FTSE, which was a downside leader during the back-half of last year, appears to have its work cut out for it if it is going to continue to work its way higher. For now, I’m going to give the benefit of the doubt to resistance (as always, respect until broken).
If the FTSE is to trade materially higher, a little back-and-forth would do it some good to build up some power before making another attempt to rally. Support clocks in around 7k, near a pair of highs from last month. The zone just above, if broken, will quickly bring the 200-day into play, another sizable headwind for the index.
For now, the feeling is that the prudent approach will be to give the market a little time to figure itself out before running with a bias in either direction. It’s around strong resistance (keeping longs at bay), but at the same time the general near-term trend structure is still supportive (keeping shorts at bay).
Check out this guide for 4 ideas on how to Build Confidence in Trading.
FTSE Daily Chart (Resistance to be problematic)
You can join me every Wednesday at 10 GMT for live analysis on equity indices and commodities, and for the remaining roster of live events, check out the webinar calendar.
Tools for Forex & CFD Traders
Whether you are a beginning or experienced trader, DailyFX has several resources available to help you; indicator for tracking trader sentiment, quarterly trading forecasts, analytical and educational webinars held daily, trading guides to help you improve trading performance, and one specifically for those who are new to forex.
---Written by Paul Robinson, Market Analyst
You can follow Paul on Twitter at @PaulRobinsonFX


