


FTSE Technical Highlights:
- FTSE trading around Sept low, Feb ’16 trend-line
- May try and build on yesterday’s reversal
- Long-term 'RST' pattern remains in progress
Looking for forecasts, long-term trade ideas, and educational content? We got you covered. Check out the DailyFX Trading Guides page for details.
FTSE trading around Sept low, Feb ’16 trend-line
Yesterday, the FTSE extended the sell-off into a critical area of support. A break of the September low took shape, but a reversal higher managed to keep price above on a closing basis. The smallish key-reversal also came at the February 2016 trend-line.
The last time we saw the market decline sharply and reverse (last month), we saw a sharp move higher. Whether such an aggressive move can develop this time or not is of course to be seen. The reversal day at support coupled with the fact the footsie is oversold in the near-term should be enough to tilt the market higher for a recovery bounce, at the least.
FTSE Daily Chart (Reversal from confluent support)
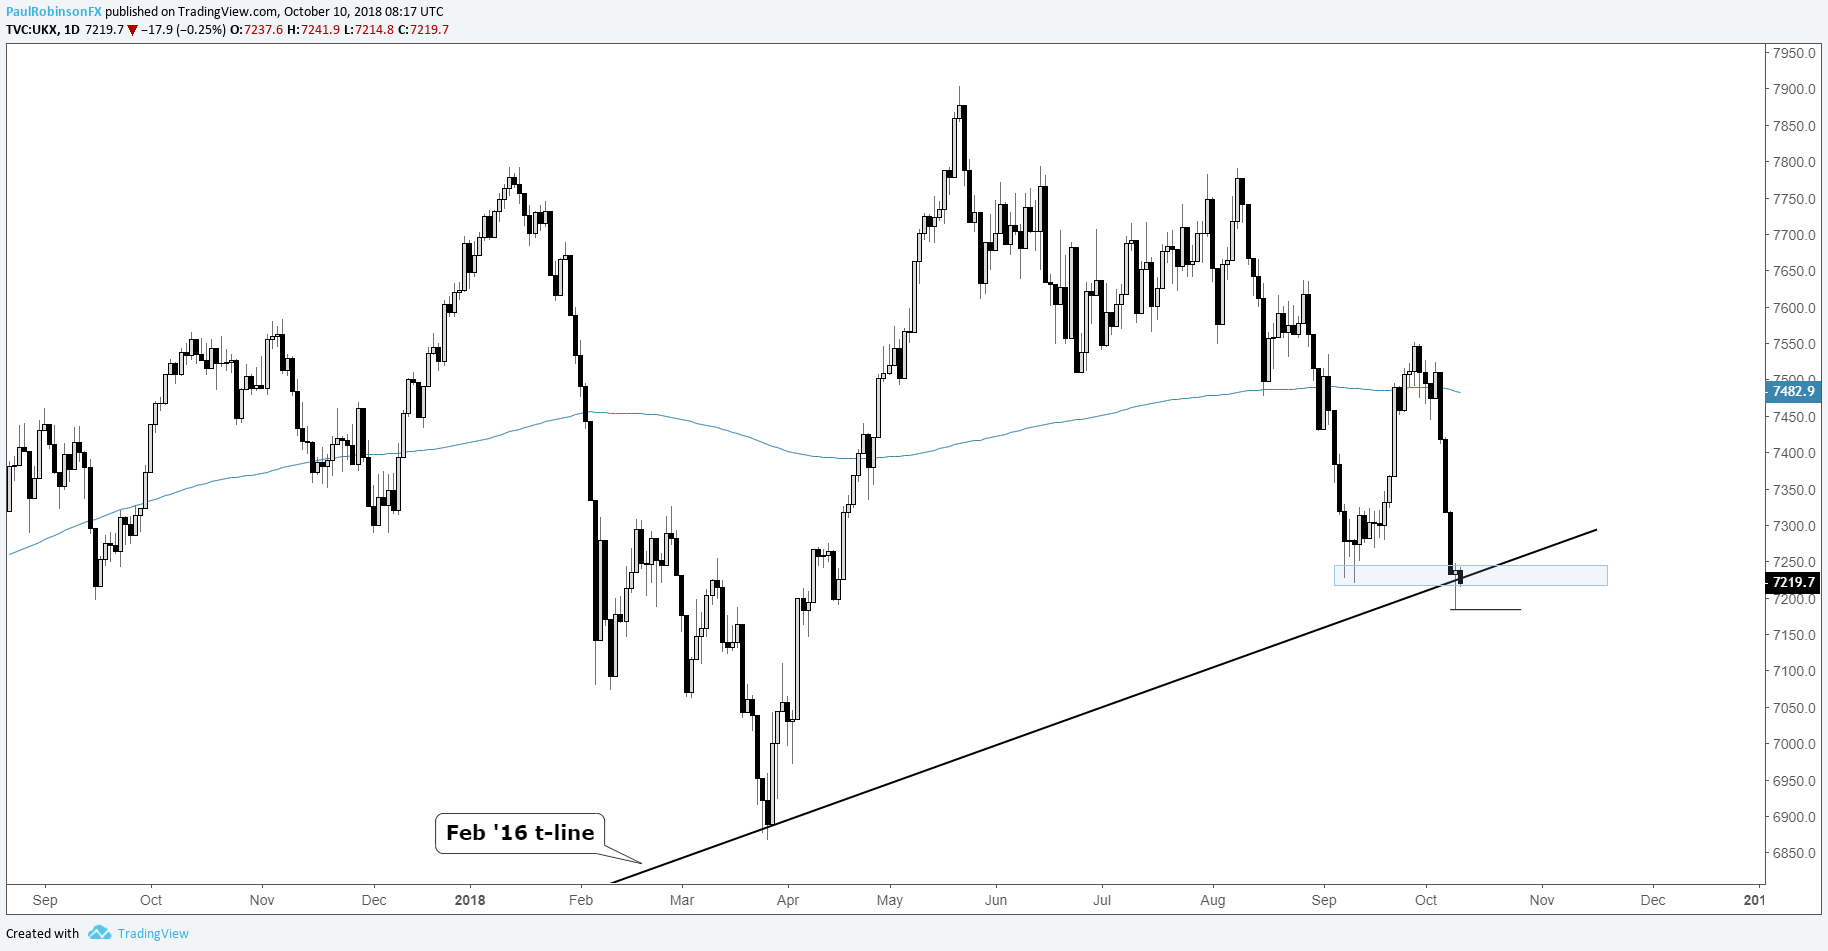
A close below yesterday’s low at 7183 will negate a reversal and will have the FTSE in real danger of sinking much further as meaningful support levels are lacking until towards the March low. From a macro standpoint, the low from the spring at some point indeed looks at risk with the ‘RST’ pattern we’ve discussed previously in full force.
Check out this guide for 4 ideas on how to Build Confidence in Trading.
FTSE Weekly Chart (‘RST’ in progress)

You can join me every Tuesday at 9 GMT for live analysis on equity indices and commodities, and for the remaining roster of live events, check out the webinar calendar.
Tools for Forex & CFD Traders
Whether you are a beginning or experienced trader, DailyFX has several resources available to help you; indicator for tracking trader sentiment, quarterly trading forecasts, analytical and educational webinars held daily, trading guides to help you improve trading performance, and one specifically for those who are new to forex.
---Written by Paul Robinson, Market Analyst
You can follow Paul on Twitter at @PaulRobinsonFX


