FTSE Technical Highlights:
- FTSE looks to have put in a lower-high, more weakness to follow
- Once strong inverse correlation with GBP turned positive
Check out the DailyFX Forecasts to find out what is driving the FTSE and GBP.
FTSE looks to have put in a lower-high, more weakness to follow
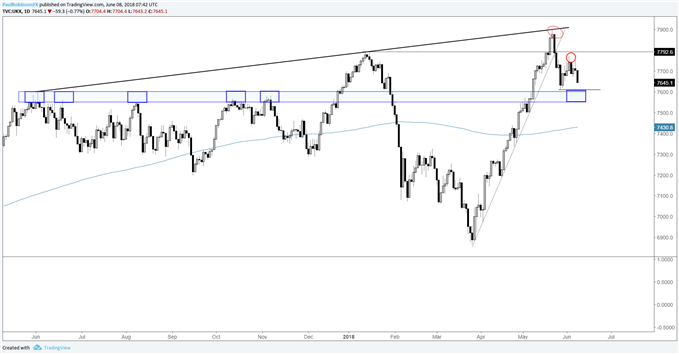
The FTSE’s vertical rise from the March low recently turned lower from the one-year top-side trend-line and possible upper-bound of a broad ‘RST’ pattern. Monday’s high and turn down has the look of a market cementing a lower-high prior to another leg lower. (For more on the long-term 'RST' pattern, see this recent FTSE commentary).
A through testing of the 7600/550-area is just around the corner. It was a very influential spot back from June to October of last year and gave the market mild hesitation early last month, but overall hasn’t been the factor it once was. Levels can come in and out of play over time and maybe this one stays out of play permanently, but for now it still bears worth watching price action on further weakness.
Should the market fail to respect the aforementioned as a form of support, then perhaps we’ll take it off the board as an important area moving forward. Other than the 200-day situated down around 7430, there aren’t any price levels to speak of which we can lean on this time should we see a drop below the recent swing-low at 7610.
Check out this guide for 4 ideas on how to Build Confidence in Trading.
FTSE Daily Chart (Lower-high)

Once strong inverse correlation with GBP turned positive
The once strongly inverse relationship between GBP and the FTSE has seen the one-month correlation move from a commanding -98% into positive territory in recent days. Bottom line: The pound has lost its influence, at least for now. As we’ve reiterated in the past, not a big fan on this end of putting too much weight into these relationships for this very reason – they can turn quickly and without warning.
Tools for Forex & CFD Traders
Whether you are a beginning or experienced trader, DailyFX has several resources available to help you; indicator for tracking trader sentiment, quarterly trading forecasts, analytical and educational webinars held daily, trading guides to help you improve trading performance, and one specifically for those who are new to forex.
---Written by Paul Robinson, Market Analyst
You can follow Paul on Twitter at @PaulRobinsonFX


