FTSE Highlights:
- FTSE decline off highs has been fairly aggressive, could be over
- But if the index fails on the current bounce, then look for 7600/7550, maybe worse
- GBP strength has impacted the past couple of weeks, could lessen in near-term
What is driving the FTSE and GBP this quarter? Find out in the Q1 Trading Forecasts.
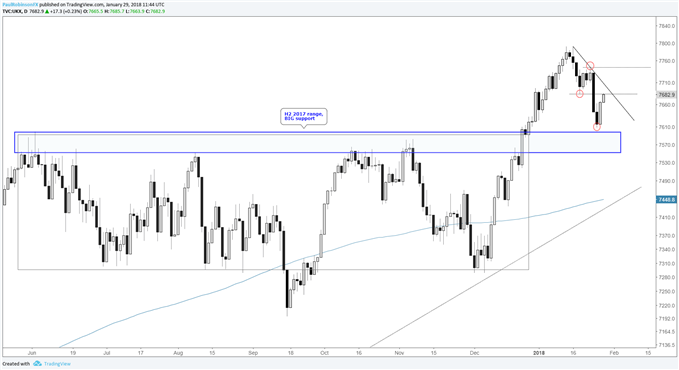
Last week, we noted that moving side-ways (a time correction) would do the FTSE some good if it is to continue moving higher, but rather than consolidate, the alternative path outlined (another leg lower) was taken. It’s possible the correction is over, but if another lower high develops in the next couple of days, a decline towards big support could be in store.
Friday’s rally was fairly aggressive, however; the FTSE needs to push strongly above 7700 to give more weight to the notion of the correction having ended. Should that be the case, then 7608 will be the swing-low to keep an on as support.
Should sellers show up in earnest and push the market below 7608, just beneath that point is a zone from 7600 down to around 7550. It will be an important one to hold if the general outlook is to remain favorable. A strong sell-off back into the range created last year would be reason to look for selling to accelerate.
Struggling right now? We’ve got a guide designed to help you – Building Confidence in Trading.
Chart – FTSE: Daily

The 2-week correlation between the FTSE and GBP is a strongly negative 86% at this time. As the 100 index is mostly comprised of multi-national companies who earn a majority of profits outside of the UK, currency fluctuations have a meaningful impact on earnings.
After a 900-point rise in GBP/USD, there is reason to believe the current pullback could deepen, which may be enough to let the footsie rise. This was the case for the European equities not long ago when EUR/USD took a breather. But as per usual, we’ll focus on the specific technical aspects of the market first, correlation second.
If you’d like to listen in on live analysis pertaining to global equity indices (and commodities), you can join me every Tuesday at 10 GMT time for technical insights.
Trader Resources
Whether you are a new or experienced trader, we have several resources available to help you; indicator for tracking trader sentiment, quarterly trading forecasts, analytical and educational webinars held daily, trading guides to help you improve trading performance, and one specifically for those who are new to forex.
---Written by Paul Robinson, Market Analyst
To receive Paul’s analysis directly via email, please SIGN UP HERE
You can follow Paul on Twitter at @PaulRobinsonFX


