What’s inside:
- Global ‘risk-off’ on North Korean missile launch over Japan
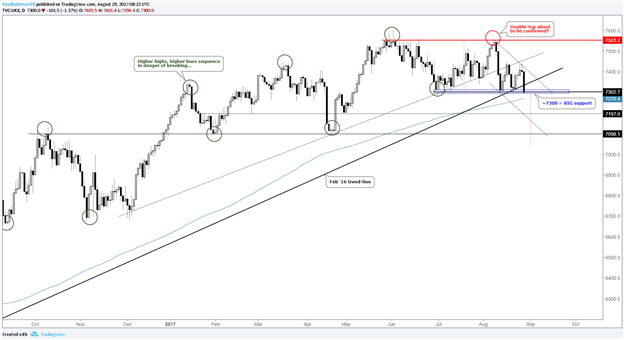
- ~7300 support in serious threat of breaking, triggering multiple technical events
- A clean drop below 7300 opens path towards 7200/100, and worse
Check out our New Educational Guides designed for traders of all experience levels.
North Korea’s missile-launch over Japan put markets on the defensive to start Tuesday from Asia to Europe to U.S. overnight index futures. The Nikkei lost about 45 bps, while the DAX is shedding nearly 1.7% and the FTSE 100 is down 1.4% in Europe. S&P 500 futures in the U.S. are down over 80 bps at the time of this writing.
The footsie is flirting with a rather sizable breakdown, as ~7300 represents not only a solid support level dating back to the end of June/early July, but also the neckline of a double-top formation under development since the market topped out in June. A close below noted support would also constitute the first lower-low since 2016 and a break of the February 2016 trend-line.
The 200-day MA is rising up to a current level of 7270, but given the proximity to key technicals breaking it is not viewed as a steadfast form of support and likely to prove to be nothing more than a speedbump for shorts at best.
Right around 7200 lies support from earlier in the year, but the real level of interest clocks in right around 7100; key swing high/lows were created here starting back in October. Looking to symmetry of the double-top, the height of the pattern calls for a move of roughly 250 points lower from 7300, or around 7050. We’ll operate off of price support, though, and go with 7100 as the next major level to contend with on a confirmed break of 7300.
FTSE 100: Daily

Paul conducts webinars Tuesday-Friday. See the Webinar Calendar for details, and the full line-up of upcoming live events.
---Written by Paul Robinson, Market Analyst
You can receive Paul’s analysis directly via email by signing up here.
You can follow Paul on Twitter at @PaulRobinonFX.


