What’s inside:
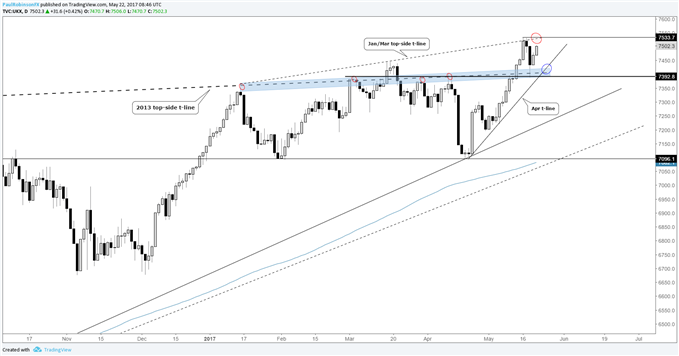
- FTSE 100 bounces hard from 2013 top-side trend-line, prior peaks
- Resistance in form of top-side line over January/March highs
- Stay above the longer-term trend-line, market remains supported; drop below things turn negative
Find out what’s driving global equity markets in our market forecasts.
On Thursday, when we last discussed the FTSE 100, this is what we had to say about the developing decline on the back of shaky U.S. politics: “Keeping it simple and consistent in approach, we’ll react to price action as per usual. On a drop into old resistance now turned potentially new support (~7400), how the market responds will be the tell.”
The ‘old resistance, new support’ we were referring to was the 2013 top-side trend-line we’ve discussed quite a bit recently, along with the peaks from March/April, which were also carved out along the same long-term trend-line. The footsie ended the day’s decline at 7389 before mounting a recovery into the close – which we are now seeing further follow-through take shape since. So far, the market’s response has been encouraging for longs.
The decline into support came from the January/March top-side trend-line which we had penciled in as resistance, but as we’ve said before it is only considered minor in nature given it’s running with the trend of the market. Nevertheless, the market reacted from it, so it’s certainly a line of influence to keep an eye on.
The two trend-lines combined are making for an interesting technical landscape which may need some time to resolve itself. Overall, the trend is higher, and again, ordering by level of influence the 2013 t-line is considered a far sturdier level of support than the overhead trend-line is considered a major source of resistance. This suggests the path of least resistance is still higher.
Further boxing in of price action and potentially bringing into play the trend-line rising up from last month’s low could make for an explosive situation. The bottom-line, though, is this – stay above noted points of support, with the 2013-line front-and-center, then the market remains constructively postured. Drop through and we can expect selling to intensify.
FTSE 100: Daily

Created with TradingView
Paul conducts webinars every week from Tuesday-Friday. See the Webinar Calendar for details, and the full line-up of all upcoming live events.
---Written by Paul Robinson, Market Analyst
You can receive Paul’s analysis directly via email by signing up here.
You can follow Paul on Twitter at @PaulRobinonFX.


