


What’s inside:
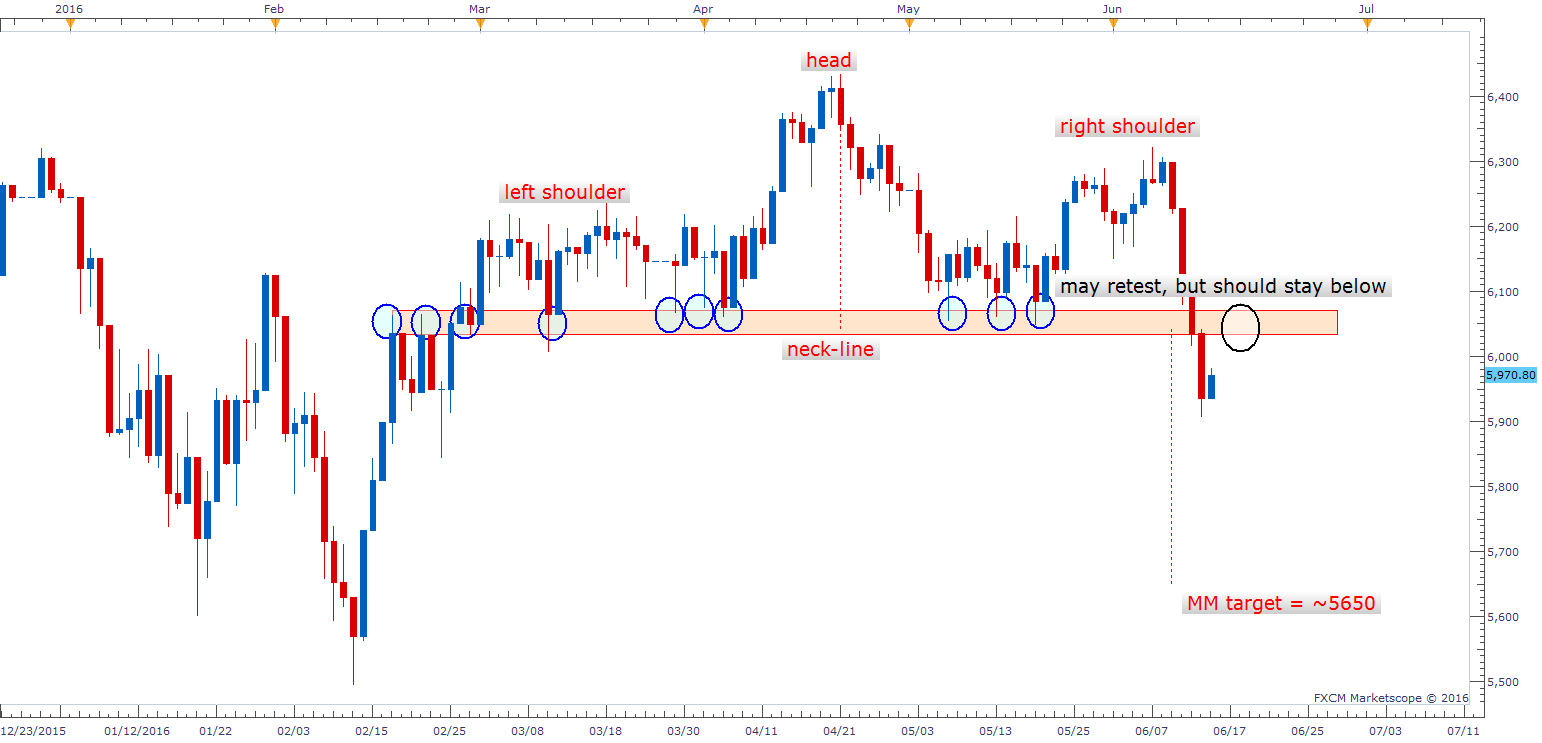
- Head-and-shoulders pattern triggered
- Major support has now become major resistance
- Sell-off has been sharp, waiting for relief rally prudent approach for establishing a short
In yesterday’s commentary we noted the big, bad breakdown the FTSE was on the verge of making from its broad multi-month head-and-shoulders pattern. With the FTSE getting clobbered by over 2%, we in fact got our confirmed break of neck-line support. It is joining the likes of its maybe-soon-not-to-be-EU-brethren in their trek south from the same bearish chart configuration. (See DAX here.)
We will be glad when this whole ‘Brexit’ situation is behind us, and the market goes back to focusing on more normal topics like, for example, central banks taking interest rates negative – Normal stuff.
For now, we will work with what the charts present to us, with a tired eye on the head-lines. The title of yesterday’s article was simple, “Major Support About to Become Major Resistance”; and that is where we are today. The massive line-in-the-sand which has kept the FTSE afloat has turned from friend to foe. The 6050/80 area will take quite a bit at this juncture to overcome, and while it may retest it, it’s not likely to be overtaken at this time.
Finding solid, tangible support levels (those which are visible on a raw price chart) is difficult at this time. We have a measured move target for the H&S pattern of ~5650, but this is a derived price target based on the height of the formation, not an actual level of support. In roughly the same area as our measured move target, there is a trend-line running from the 2009 low connecting to the February low. However, given the distance between the two connecting points in proximity to the next possible one (which could be soon) we will view it with a skeptical eye. Nevertheless, if we do get down there we will pay close attention to whether the market cares about it or not. Beyond the ‘MM’ target and that trend-line we really have to look to the Feb low at 5494 to find substantial support.
But before we get ahead of ourselves, a lot can happen between now and then. The move down has been violent since providing a nice sell signal at the peak over a week ago, and as such the market could use a bounce to work off its ‘oversoldness’. With that in mind, waiting for a counter-trend rally and/or consolidation of recent losses before entering is a prudent approach.
FTSE (UK100) Daily
High impact event alert: Central banks will be busy the next two days. First, the FOMC later today, then early morning tomorrow the BoJ, and then later on tomorrow the BoE. For further details, check out our calendar.
Get trader positioning in real-time, check out our ‘Speculative Sentiment Index (SSI).
---Written by Paul Robinson, Market Analyst
You can follow Paul on Twitter at @PaulRobinsonFX, and/or email him directly at instructor@dailyfx.com.


