


Talking Points
- The FTSE 100 was, at the time of writing, trading near to last week’s low of 6261.
- Support levels below 6261 are the psychological level of 6200, the April 11 low of 6162, the April 7 low of 6105, and the April 5 low at 6060.
- A cluster of resistance starts with the December high of 6447 and is followed by the October 23 high of 6485.
The FTSE 100 (CFD: UK100) added to Friday’s decline with the start of the new trading week. The price was, at the time of writing, trading near to last week’s low of 6261. The declines so far today have been driven by strong declines in the shares of Materials and Energy firms. The sectors were down by 2.57% and 2.15% correspondingly. The winning sector at the time of writing was the Utilities Sector, which was up by 0.73%.
Technically, the multi-week trend remains bullish, as last week’s low of 6261 is higher than the preceding swing low of 6162, formed on April 11. However, the price is very close to trading below last week’s low of 6259.
Support levels below 6261 are the psychological level of 6200, the April 11 low of 6162, the April 7 low of 6105, and the April 5 low at 6060.
A cluster of resistance starts with the December high of 6447 and is followed by the October 23 high of 6485. This junction is important because prices spent two months trying to breach it without succeeding and because there is no major resistance level until the August high of 6760. The gap between the October 23 high and the August high is 4.2%, something that may attract trader’s interest.
The latest German IFO index report was published this morning. The Business Climate index outcome was 106.6 vs. a Bloomberg News survey projecting a rise to 107.1. Similarly, to the German PMIs that were published last week, the IFO gives us an early indication of economic developments in Germany. As the outcome was lower than expected, the German DAX breached its April 20 low of 10,283 and ended the very short-term bullish trend. Given the FTSE 100’s strong bonds with the DAX 30 and the fact that a large part of U.K. exports are linked to the Eurozone, the DAX’s decline may influence the FTSE 100.
The are no market moving events on deck for the FTSE for the rest of the session.
Our Stock Market forecasts for Q2 2016 are now live on the site. Download them for free.
FTSE 100 | CFD: UK100
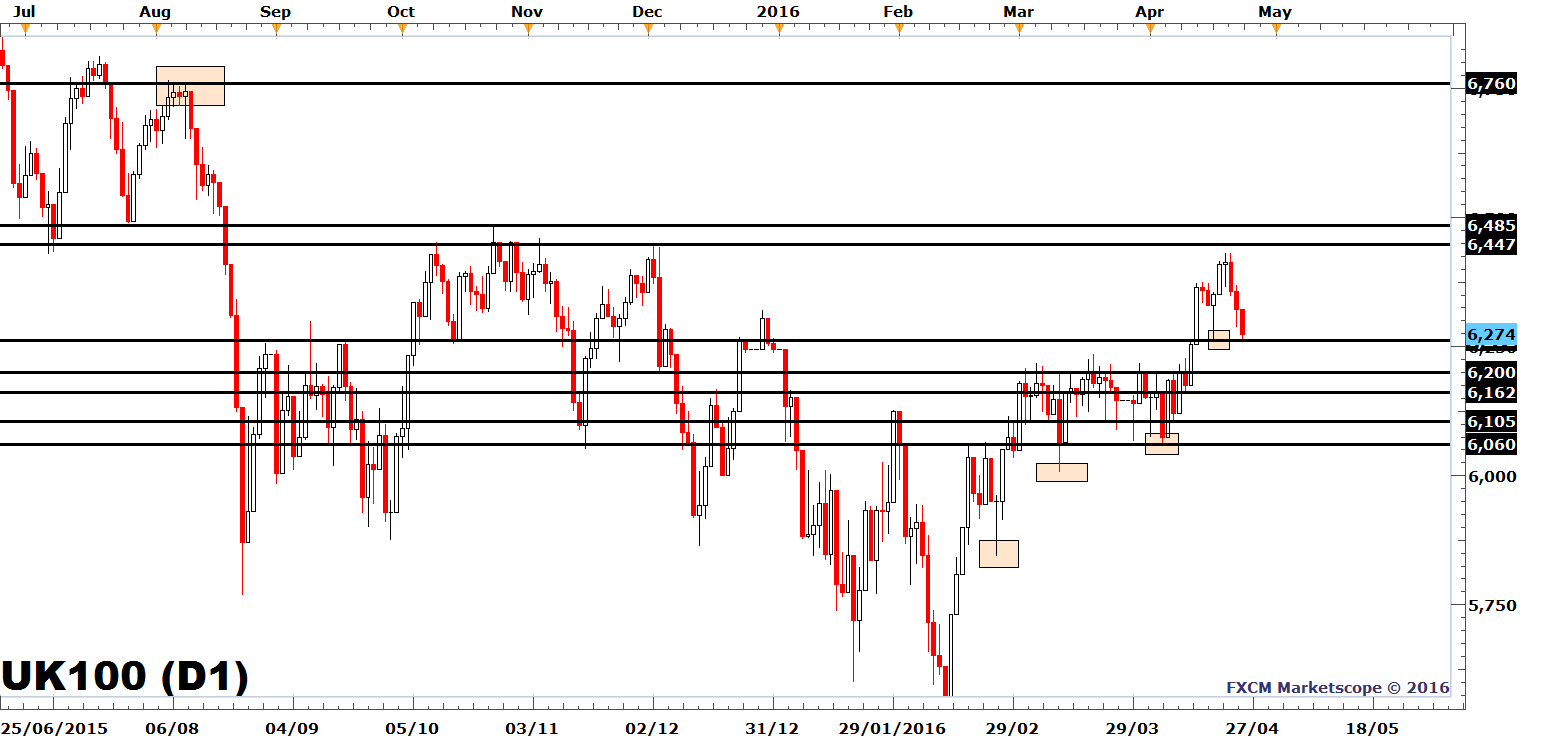
Created with Marketscope/Trading Station II; prepared by Alejandro Zambrano
--- Written by Alejandro Zambrano, Market Analyst for DailyFX.com
Contact and follow Alejandro on Twitter: @AlexFX00


