


Talking Points
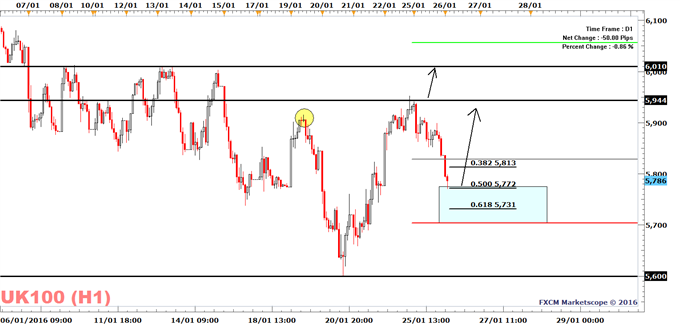
- The FTSE 100 has now reached the 5700 to 5800 range, where I would expect traders to buy.
- However, the macro and technical picture is gloomy: the China CSI 300 index plunged 6.02% and Dallas Fed Manufacturing Index takes the sharpest plunge in 11 years.
- With this in mind, some traders will probably wait for a complete bullish trend instead of buying the dip.
- Nationwide data is also on tap today: U.S. house prices, Markit PMI Services, and Consumer confidence, along with Richmond Fed data.
Losing Money Trading? This Might Be Why
The FTSE 100 has now given back 50% of last week’s gains. This is in line with yesterday’s outlook, when we stated that “In the short-term, the trend is bearish below this week’s high of 5944 and the index may drift to the 5700 to 5800 range.”
As price is now in the 5700 to 5800 range the risk/reward ratio favors long positions and signs of people buying in this zone (similar to a bullish candlestick pattern) should be enough to initiate a trade with stops below last week’s low.
However, there are legitimate reasons for the latest slide and strong caution is warranted.
Firstly, the China CSI 300 index (blue chip stocks of China) is down 6.02% in today’s trading. The decline is strong enough for the index to have breached its August lows. Simple technical analysis suggests that the CSI 300 index may decline an additional 15% before support from November 2014 meets price. This may weigh heavily on the FTSE 100.
Secondly, the Dallas Fed Manufacturing Index takes the sharpest plunge in 11 years, the index having declined to -34.6 from -20.1. These are levels not seen since the 2008 recession. As an example, at the onset of the 2008 recession the Dallas Fed index was at -22.3. The situation is different today, with the current U.S. crisis being in the energy markets, hence the “pain” should be more pronounced in the country’s biggest oil producing state, yet yesterday’s reading was outright bad.
With this in mind, some traders will probably wait for a complete bullish trend instead of buying the dip. Right now a break to this week’s high of 5944 is needed (or the next swing high, which still needs to be created between today’s price and the current weekly high).
Traders opting for a bearish view will probably short-sell on a correction to the 5850 to 5944 range.
Nationwide data is on tap today; U.S. house prices, Markit PMI Services, and Consumer confidence. Richmond Fed data is also on tap. See our economic calendar
FTSE 100 | FXCM: UK100
Created with Marketscope/Trading Station II; prepared by Alejandro Zambrano
--- Written by Alejandro Zambrano, Market Analyst for DailyFX.com
Twitter: @AlexFX00
Read Charts Like Alejandro: Join a London Seminar or get the On-Demand Version


