U.S. Indices Technical Outlook:
- S&P 500 may bounce short-term, but look for it to fail
- Nasdaq 100 has some support to watch, but not expected to hold for long


S&P 500, Dow Jones, Nasdaq 100 Outlook: Bounce Seen as Failing Quickly
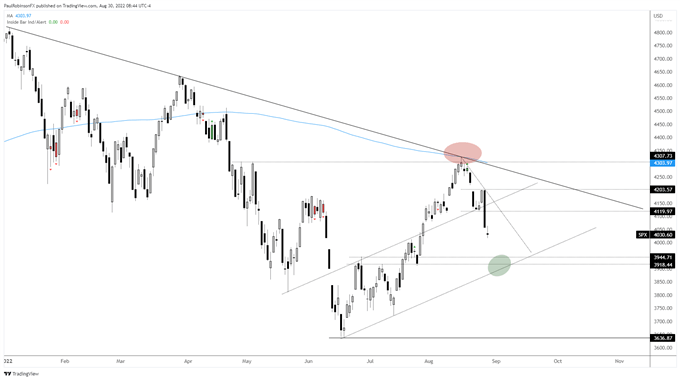
The market appears to be firmly back in bear market mode after the summer rally retraced a chunk of the January to July down-move. With that in mind it is anticipated that any rallies that develop from short-term oversold conditions will be short-lived.
Currently there aren’t any meaningful support levels to watch, which would make any bounce we see from current levels even more vulnerable to failing quickly. Down around 3950/900 there is a decent zone of support, one that could induce a sharp near-term inflection point if it is reached soon.
The bounce from support such as this might be powerful, but again it is likely to be short-lived if we have indeed turned the corner lower. The timing as we head into the worst time of the year suggests also we could see the summer low at 3636 broken in the weeks ahead.
On a bounce from current levels the first meaningful level of resistance to watch is the low (4120) last week before the Friday Jackson Hole sell-off. It is around the trend-line off the August high. Given the sharp shift on Friday it may be difficult to reach those levels.
S&P 500 Daily Chart

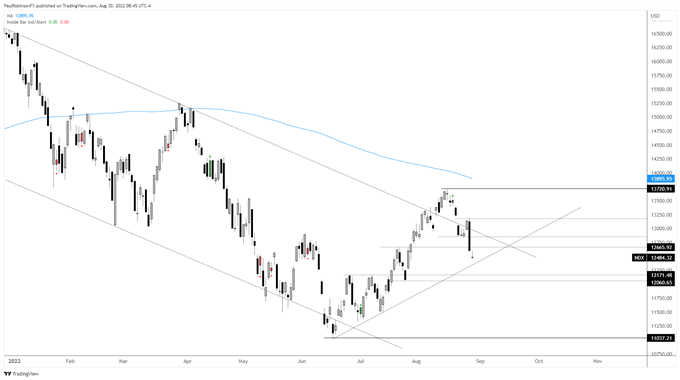
The Nasdaq 100 is near the trend-line off the June low, but isn’t seen as likely to hold. The NDX may, however, find support around 12170/060. If the market can muster a bounce look for 12852 to be problematic to cross.
Nasdaq 100 Daily Chart

Nasdaq 100 Chart by TradingView
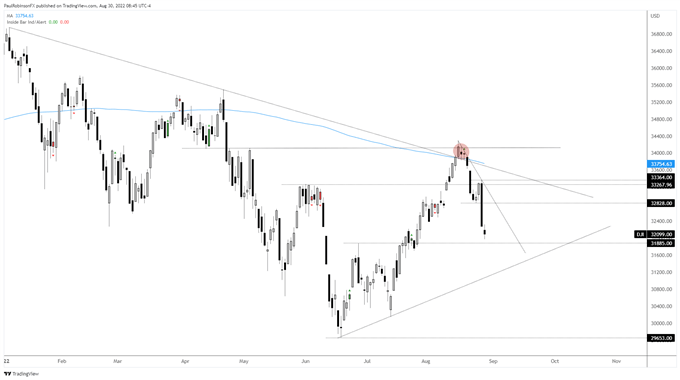
The Dow Jones has some support around 31885, then the trend-line off the lows. Resistance clocks in at the trend-line off the recent high and 32828. The outlook is of course the same as the other indices, same bias just different levels.
Dow Jones Daily Chart

Dow Jones Chart by TradingView
Resources for Forex Traders
Whether you are a new or experienced trader, we have several resources available to help you; indicator for tracking trader sentiment, quarterly trading forecasts, analytical and educational webinars held daily, trading guides to help you improve trading performance, and one specifically for those who are new to forex.
---Written by Paul Robinson, Market Analyst
You can follow Paul on Twitter at @PaulRobinsonFX


