


Dow Jones Technical Price Outlook: Short-term Trade Levels
- Dow Jones technical trade level update – Daily & Intraday Charts
- DJI plunges from yearly downtrend resistance– pullback approaching short-term uptrend support
- Resistance 33302, 33734, 34102/164 (key)- Support 31421, 31014, 30630
The Dow Jones Industrial Average plunged more than 7% off the August high with DJI turning negative for month. The reversal off yearly downtrend resistance shifts the focus to near-term support and the first real test of the June uptrend. These are the targets and invalidation levels that matter on the Dow Jones technical price charts into the close of the month / week. Review my latest Strategy Webinar for an in-depth breakdown of this DJI technical setup and more.
Dow Jones Industrial Average Price Chart – DJI Daily
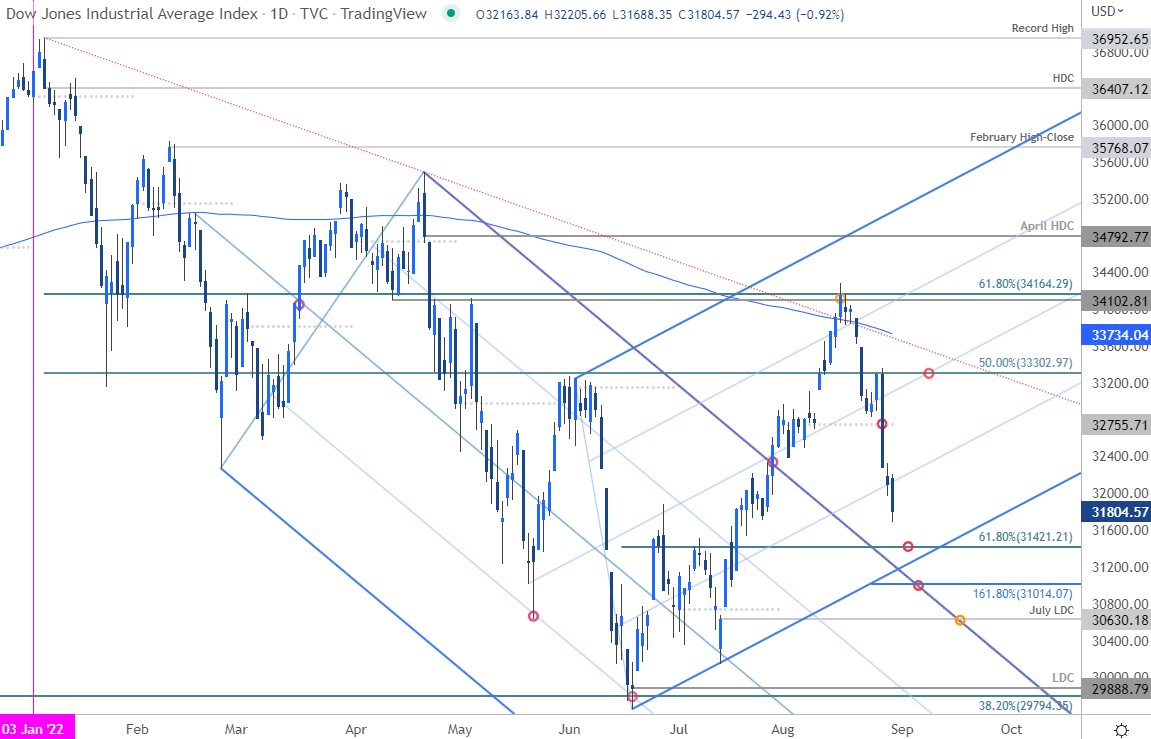
Chart Prepared by Michael Boutros, Technical Strategist; SPX500 on Tradingview
Technical Outlook: In last month’s Dow Jones Short-term Technical Outlook we noted that DJI had, “rebounded off downtrend support with the recovery now approaching downtrend resistance- we’re on the lookout for possible topside exhaustion.” The index ripped into resistance on August 16th at the 61.8% Fibonacci retracement of the yearly range at 34164 with the price unable to mark a daily close above. A break of the monthly opening-range last week has fueled a decline of more than 7% off the highs with the pullback now approaching the first real test of short-term uptrend support.
Dow Jones Industrial Average Price Chart – DJI 240min
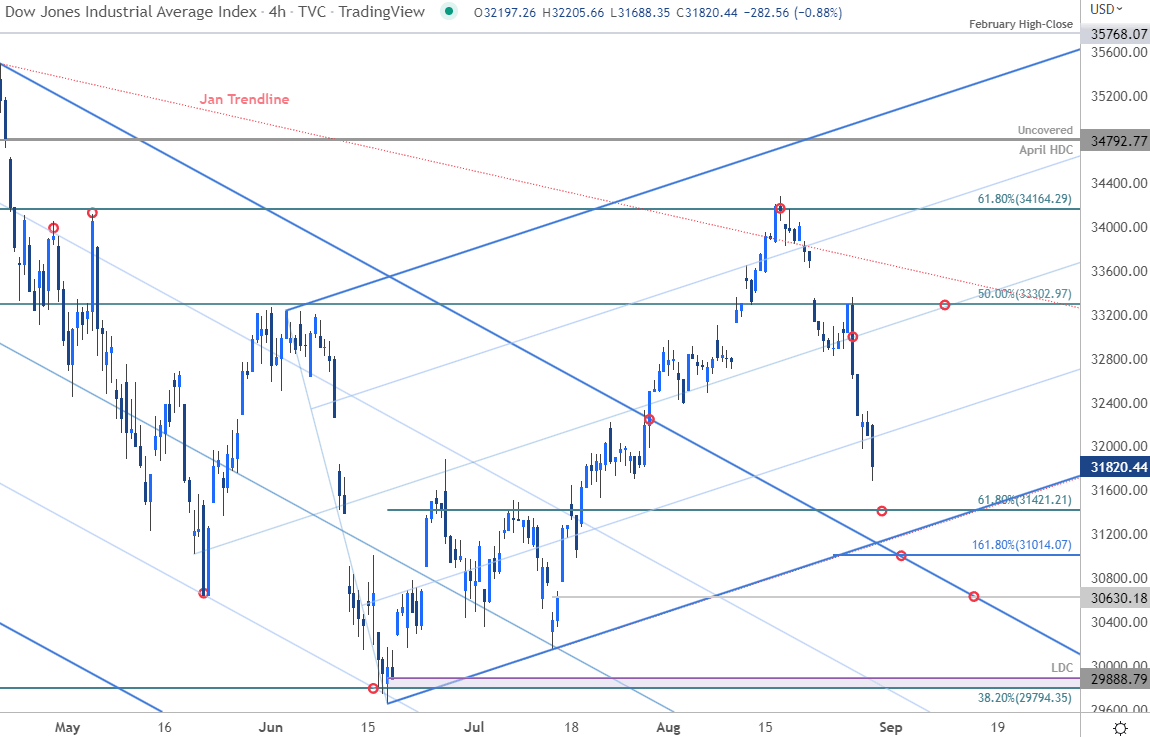
Chart Prepared by Michael Boutros, Technical Strategist; DJI on Tradingview
Notes: A closer look at short-term Dow Jones price action shows the index continuing to trade wtihin the confines of the ascending pitchfork formation extending we’ve been tracking since last month. A break below the median-line keeps the focus on near-term support objectives at the 61.8% retracement of the June rally at 31421 and the 1.618% extension at 31014– both levels of interest for possible price inflection IF reached. Note that a break below this formation would threaten resumption of the broader yearly downtrend with such a scenario exposing the July low-day close at 30630 and the yearly low-day close / 38.2% retracement at 29794/888. Initial resistance now back at 33302 backed by the 200-day moving average near ~33734 with a breach / daily close above the January trendline needed to suggest a more significant low is in place / a larger breakout is underway.

Bottom line: The Dow Jones Industrial Average has responded to yearly downtrend resistance with the pullback now approaching short-term uptrend support. From a trading standpoint, the threat rises for downside exhaustion on a stretch towards the lower parallels- look for a larger price reaction there IF reached. Keep in mind we are heading into the close of the month with US Non-Farm Payrolls (NFP) on tap ahead of an extended holiday break – stay nimble here. Review my last Dow Jones Weekly Technical Forecast for a closer look at the longer-term DJI technical trade levels.
For a complete breakdown of Michael’s trading strategy, review his Foundations of Technical Analysis series on Building a Trading Strategy
Dow Jones Industrial Average Trader Sentiment – DJI Price Chart
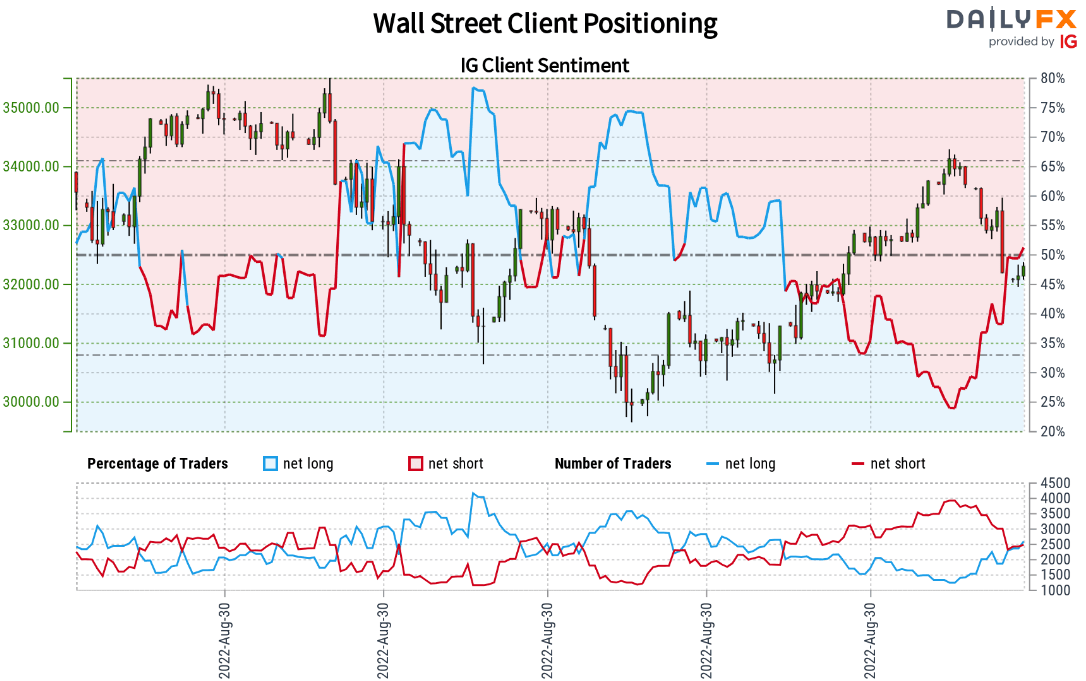
- A summary of IG Client Sentiment shows traders are net-short the Dow- the ratio stands at -1.00 (49.93% of traders are long) – typically a neutralreading
- Long positions are0.91% higher than yesterday and 30.46% higher from last week
- Short positions are 1.70% lower than yesterday and 24.64% lower from last week
- We typically take a contrarian view to crowd sentiment, and the fact traders are net-short suggests DJI prices may continue to rise. Yet traders are less net-short than yesterday and compared with last week. Recent changes in sentiment warn that the current Dow Jones price trend may soon reverse lower despite the fact traders remain net-short.

US Economic Calendar
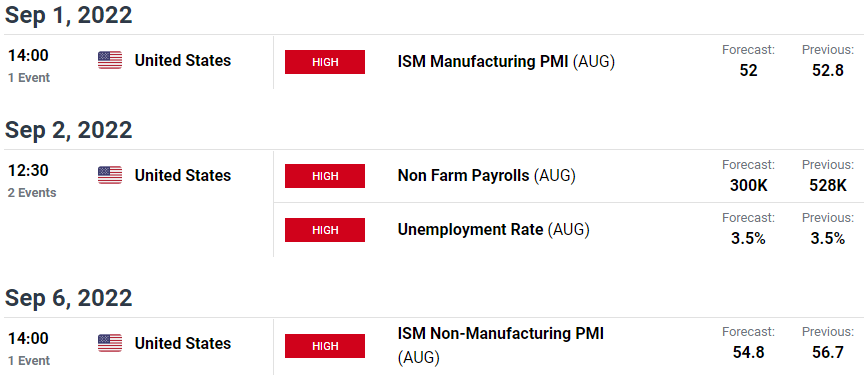
Economic Calendar - latest economic developments and upcoming event risk
Active Technical Setups
- US Dollar Technical Trade Setups: Crude Oil, EUR/USD, USD/CAD Levels
- Crude Oil Short-term Technical Outlook: WTI at Key Support- Decision Time
- Gold Price Short-term Technical Outlook: Gold Rally Rejected at Resistance
- Canadian Dollar Short-term Price Outlook: USD/CAD Rally Under Review
- US Dollar Short-term Technical Outlook: USD Breakout Pending
-Written by Michael Boutros, Technical Strategist with DailyFX
Follow Michael on Twitter @MBForex


