


U.S. Indices Technical Outlook:
- Stocks looks poised to continue the recovery rally in the near-term
- While more strength is anticipated it isn’t viewed as likely to maintain

S&P 500, Dow Jones, Nasdaq 100 Recovery Set to Continue
The stock market is bouncing, for now, and is anticipated to continue to hold a modest bid in the short-term. However, the outlook more broadly speaking still looks quite bearish in the second half of the year.
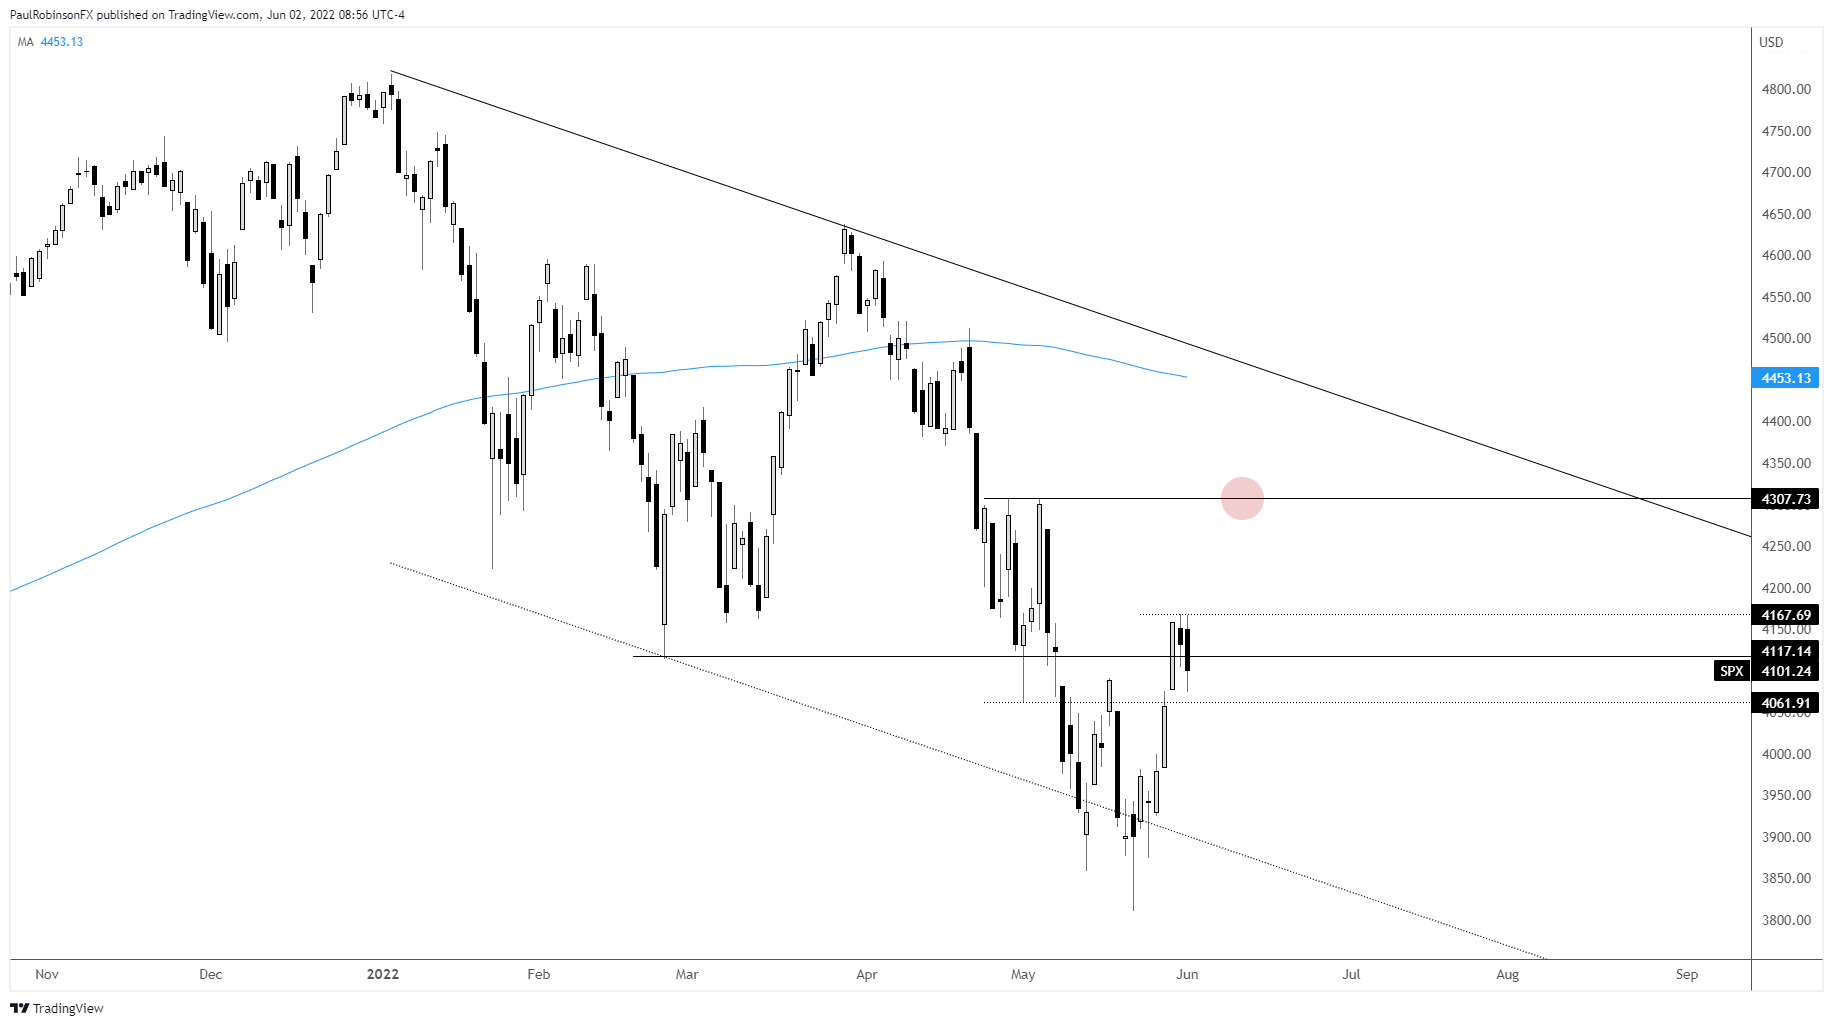
The S&P 500 showed some real power off the May low and in the past couple of sessions it has dipped a bit, which is to be expected. The dip could offer would-be longs an opportunity to continue playing a bounce. But only a bounce.
The rally isn’t expected to go much past 4300, which means the large chunk of the bounce may be over in terms of price. But there may be some time burnt between now and where the S&P ends up before another leg lower develops.
Recovery bounces in an ongoing bear sequence tend to last between 4 to 8 weeks. Right now we are at about 2 weeks, so there appears to be a little time on the market’s side.
The price action to date has been quite bearish for stocks, yet we have not seen any real kind of capitulation or fear by market participants. Sure the VIX has risen a few times into the high 30s, but it appears that is becoming the high-end of a new normal in vol.
The lack of a significant spike in volatility suggests the Pavlov response by the market to ‘buy-the-dip’ is still well intact despite how far we have come off the highs. What we have typically seen over the years during this bull market is that when the market gets 10-20%+ off the highs fear rises sharply (VIX spikes) and a bottom is put in. What we are seeing now marks a change in behavior. From where I sit it is a very bearish one at that.
The bottom line is that fear tends to rise in-line or disproportionately compared to the depth of the decline and marks a wash-out low. This does not seem to be the case this go around. The thinking at this time is that until we see the VIX spike to 50,60 or even higher on waterfall type price action the downward trajectory for stocks will continue.
S&P 500 Daily Chart
VIX Daily Chart

It bears keeping a close eye on the Nasdaq 100 while all this plays out. It has been the leader on the way up and since the beginning of the year the leader on the way down. It’s looking like the NDX is going to continue that
Nasdaq 100 Daily Chart

Nasdaq 100 Chart by TradingView
The Dow Jones is a bit stronger, as it has been, and this is likely to continue. But it too will get hit hard with the market if we are to see a broad sell-off develop at some point. Look for the 34k area to be about as high as the Dow can get if the bearish outlook is to hold up.
Dow Jones Daily Chart

Dow Jones Chart by TradingView
Resources for Forex Traders
Whether you are a new or experienced trader, we have several resources available to help you; indicator for tracking trader sentiment, quarterly trading forecasts, analytical and educational webinars held daily, trading guides to help you improve trading performance, and one specifically for those who are new to forex.
---Written by Paul Robinson, Market Analyst
You can follow Paul on Twitter at @PaulRobinsonFX


