


S&P 500, Nasdaq Technical Price Outlook: Near-term Trade Levels
- S&P 500 technical trade level update – Daily & Intraday Charts
- SPX500 plunges towards support at the yearly lows- rallies could be short-lived
- SPX Resistance 4309, 43921, 4450(key) - Support 4117, 4416/35 (critical)
The S&P 500 plummeted more than 10% off the March highs with a major technical break in the index now threatening a run on the yearly lows. These are the targets and invalidation levels that matter on the SPX500 technical price charts this week. Review my latest Strategy Webinar for an in-depth breakdown of this SPX500 setup and more.
S&P 500 Price Chart – SPX500 Daily
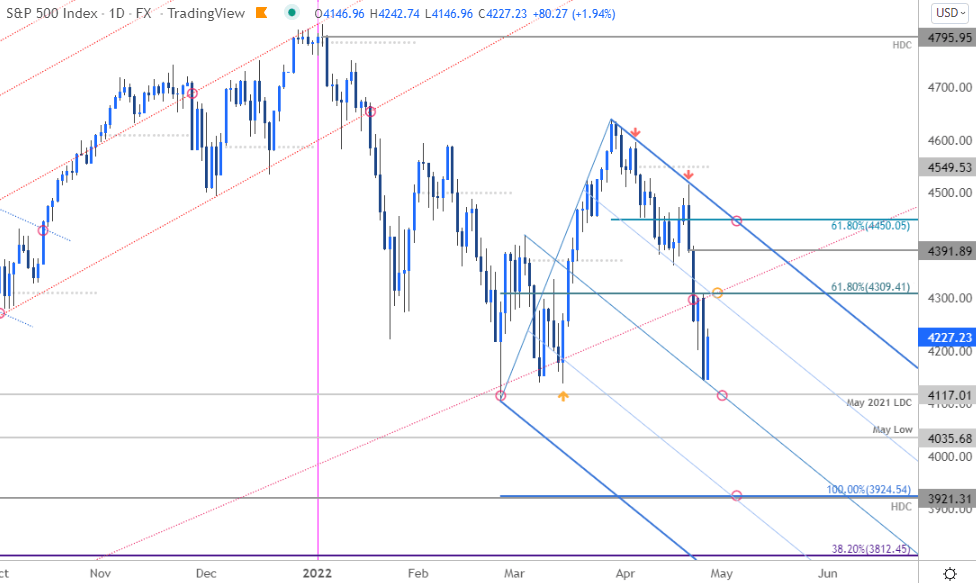
Chart Prepared by Michael Boutros, Technical Strategist; SPX500 on Tradingview
Technical Outlook: In my last S&P 500 technical outlook we noted that the SPX500, “remains at risk for further losses near-term and we’re on the lookout for a possible low in the days ahead closer to trend support.” An outside-day reversal off slope resistance on April 21st was followed by a break below key Fibonacci support at 4309– The flood gates have opened.
S&P 500 Price Chart – SPX500 240min

Chart Prepared by Michael Boutros, Technical Strategist; SPX500 on Tradingview
Notes: A closer look at SPX500 price action shows the index trading within the confines of a descending pitchfork formation extending off the March high with price rebounding today just points ahead of the median-line. Initial resistance now 4309/16 and the 4/21 outside reversal-day close at 4391- both levels of interest for possible topside exhaustion IF reached. Broader bearish invalidation now lowered to the 61.8% retracement / February opening-range low at 4446/50. Initial support now at the May 2021 low-day close / March low at 4117/37 exposes subsequent objective at the May low (4035) and the 100% extension of the decline off the yearly high at 3924- look for a larger reaction there IF reached.

Bottom line: The technical damage has been done and S&P 500 remains at risk for further losses. From a trading standpoint, look for an exhaustion high ahead of 4391 on recoveries with a break lower likely to fuel another accelerated drop toward fresh yearly lows. Review my latest S&P 500 Weekly Technical Forecast for a closer look at the longer-term SPX 500 technical trade levels.
For a complete breakdown of Michael’s trading strategy, review his Foundations of Technical Analysis series on Building a Trading Strategy
S&P 500 Trader Sentiment – US500 Price Chart
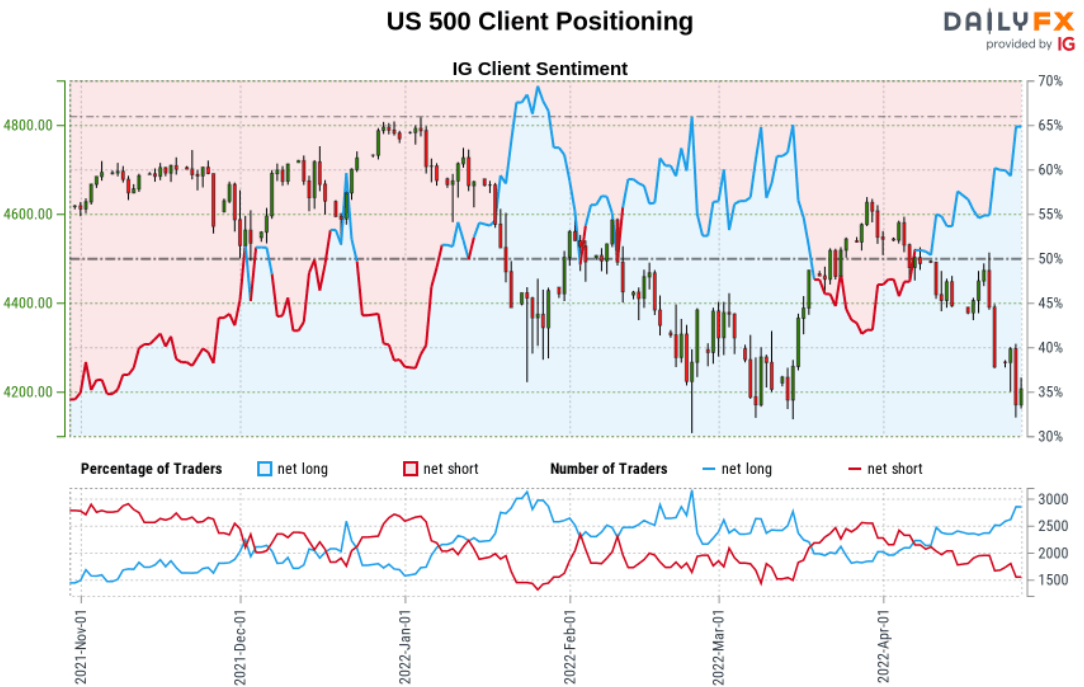
- A summary of IG Client Sentiment shows traders are net-long the S&P 500- the ratio stands at +1.64 (62.13% of traders are long) – typically a bearishreading
- Long positions are2.54% higher than yesterday and 15.27% higher from last week
- Short positions are 14.31% lower than yesterday and 13.66% lower from last week
- We typically take a contrarian view to crowd sentiment, and the fact traders are net-long suggests US 500 prices may continue to fall. Traders are further net-long than yesterday and last week, and the combination of current positioning and recent changes gives us a stronger SPX500-bearish contrarian trading bias from a sentiment standpoint.

US Economic Calendar
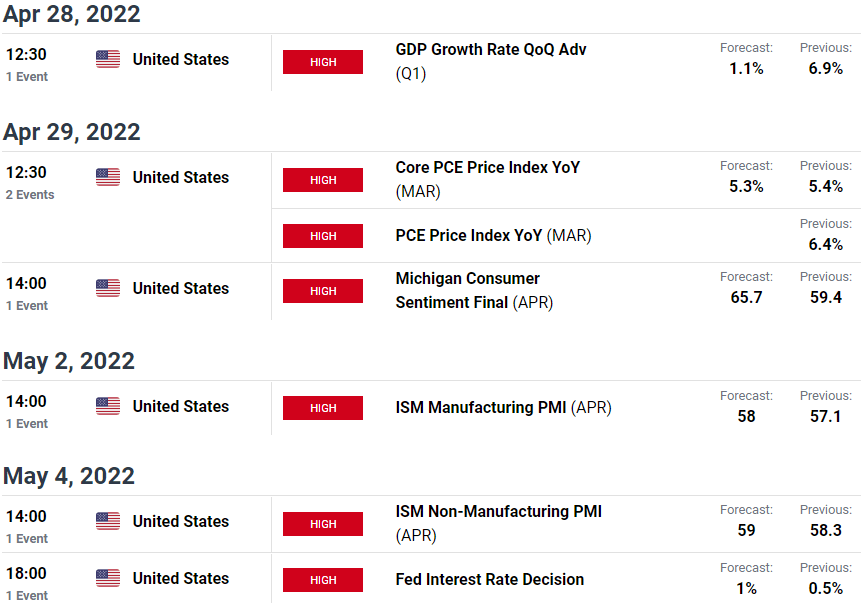
Economic Calendar - latest economic developments and upcoming event risk.
Active Technical Setups
- Gold Technical Outlook: Gold Gut Check- XAU/USD Bulls Eye Support
- EUR/USD Technical Price Outlook: Dollar Breakout or Euro Fake-out?
- Canadian Dollar Technical Outlook: USD/CAD Reaches for Resistance
-Written by Michael Boutros, Technical Strategist with DailyFX
Follow Michael on Twitter @MBForex


