


U.S. Indices Technical Outlook:
- S&P 500 trading around the 200-day moving average again
- Nasdaq 100 declining but could carve out inverse H&S
- Dow Jones has support around the 34k level

Dow Jones, Nasdaq 100, S&P 500 Technical Outlook
The S&P 500 has been in retracement mode, with it currently trading around the 200-day moving average again. The decline so far isn’t overly aggressive, and somewhat expected given the initial blast off from near the March low.
The question is whether or not we may be witnessing a larger topping process unfold, where the recent leg will end up as a lower high from the record high set in January. If this is the case, then we could be in a for a very volatile rest of the year. It’s a little early to tell if this will be the case, but overall a possibility to consider.
On the flip-side, we may have an inverse head-and-shoulders brewing that is developing in-line with the longer-term trend. The left shoulder would be the low in late January, the head created in March, and then ultimately a low and turn higher will be needed to form out the right shoulder.
The inverse H&S outlook could then lead to a new record high. But before we can worry about either scenario more time will need to pass. For now, keeping things short-term and looking to trade the week-to-week volatility.
During the current decline if the 200 fails to keep the SPX afloat, look to a swing high created in March at 4415 as the next level of potential support. On the top-side as resistance the area around 4590 has been in play several times since January, and then the 4637 high just beyond that.
S&P 500 Daily Chart

The Nasdaq 100 is basically just a cleaner pattern variation of the S&P 500, but weaker overall. Instead of having the 200-day as support, it is well below the threshold as it acted as resistance just days ago. Keep an eye on the March 3 high at 13342 as a potential source of support in the near-term. Resistance clocks in at 15154/265.
Nasdaq 100 Daily Chart
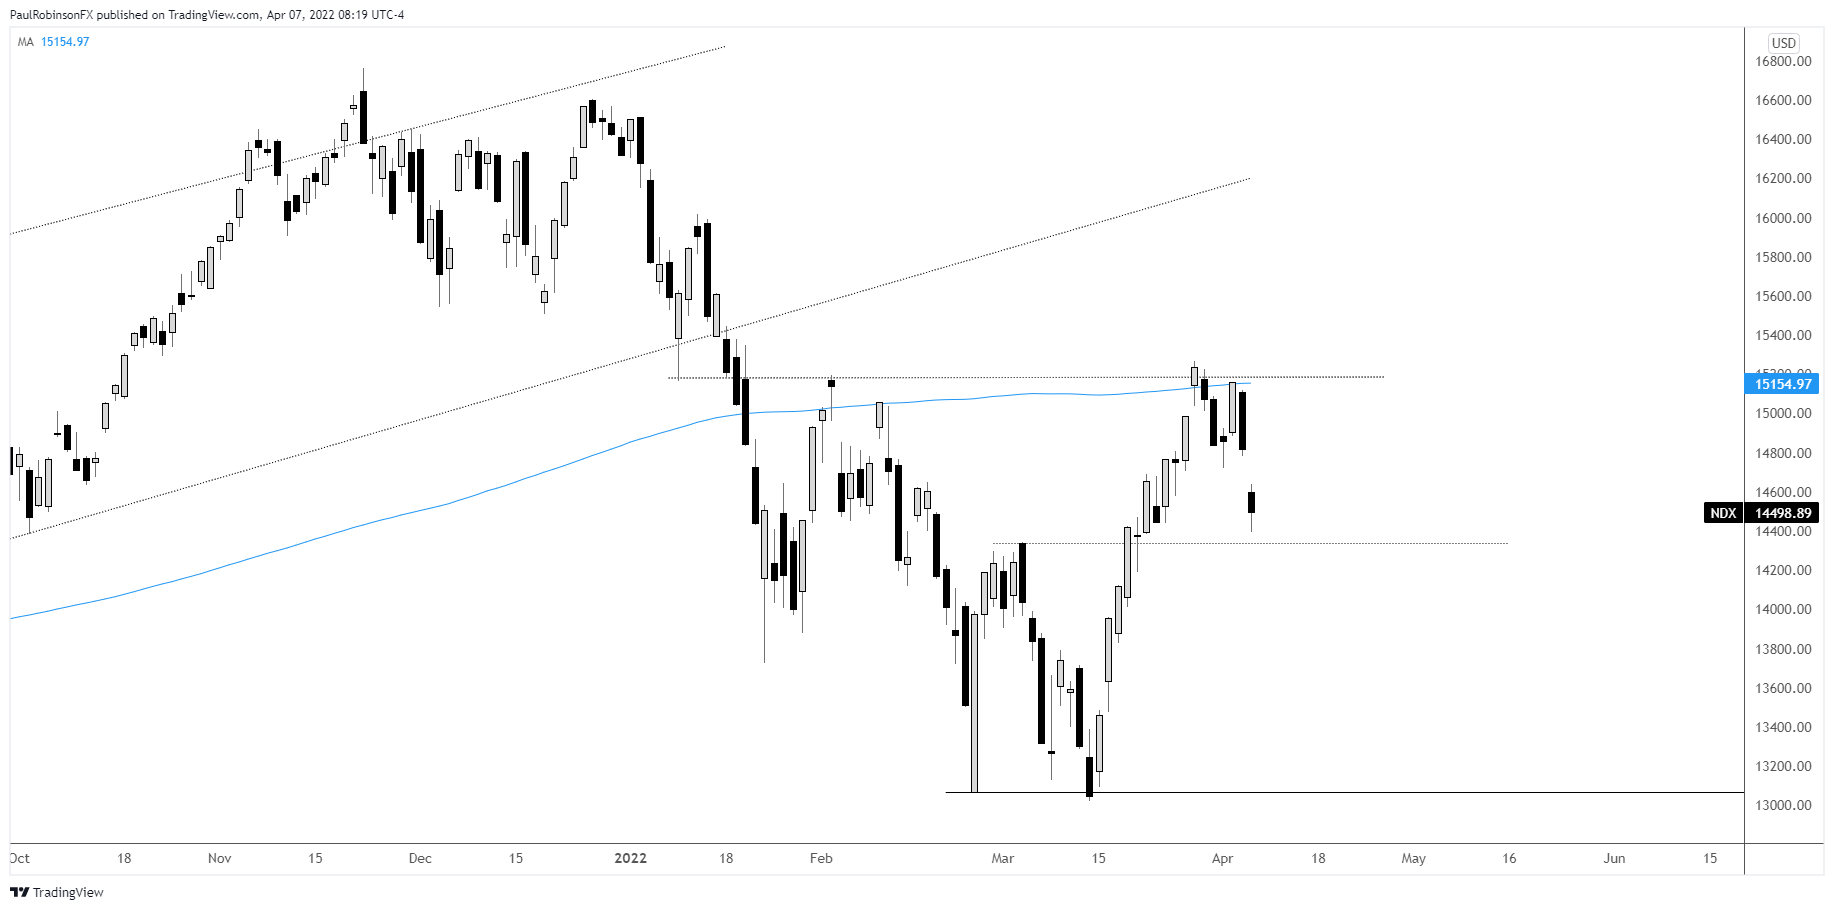
Nasdaq 100 Chart by TradingView
The Dow Jones doesn’t have the same kind of symmetry as the NDX and SPX, and a is a bit more of a difficult handle. There is, however, a fairly clear area of support around the 34k mark. A drop to and reversal from that area could provide a trade for would-be longs.
Dow Jones Daily Chart
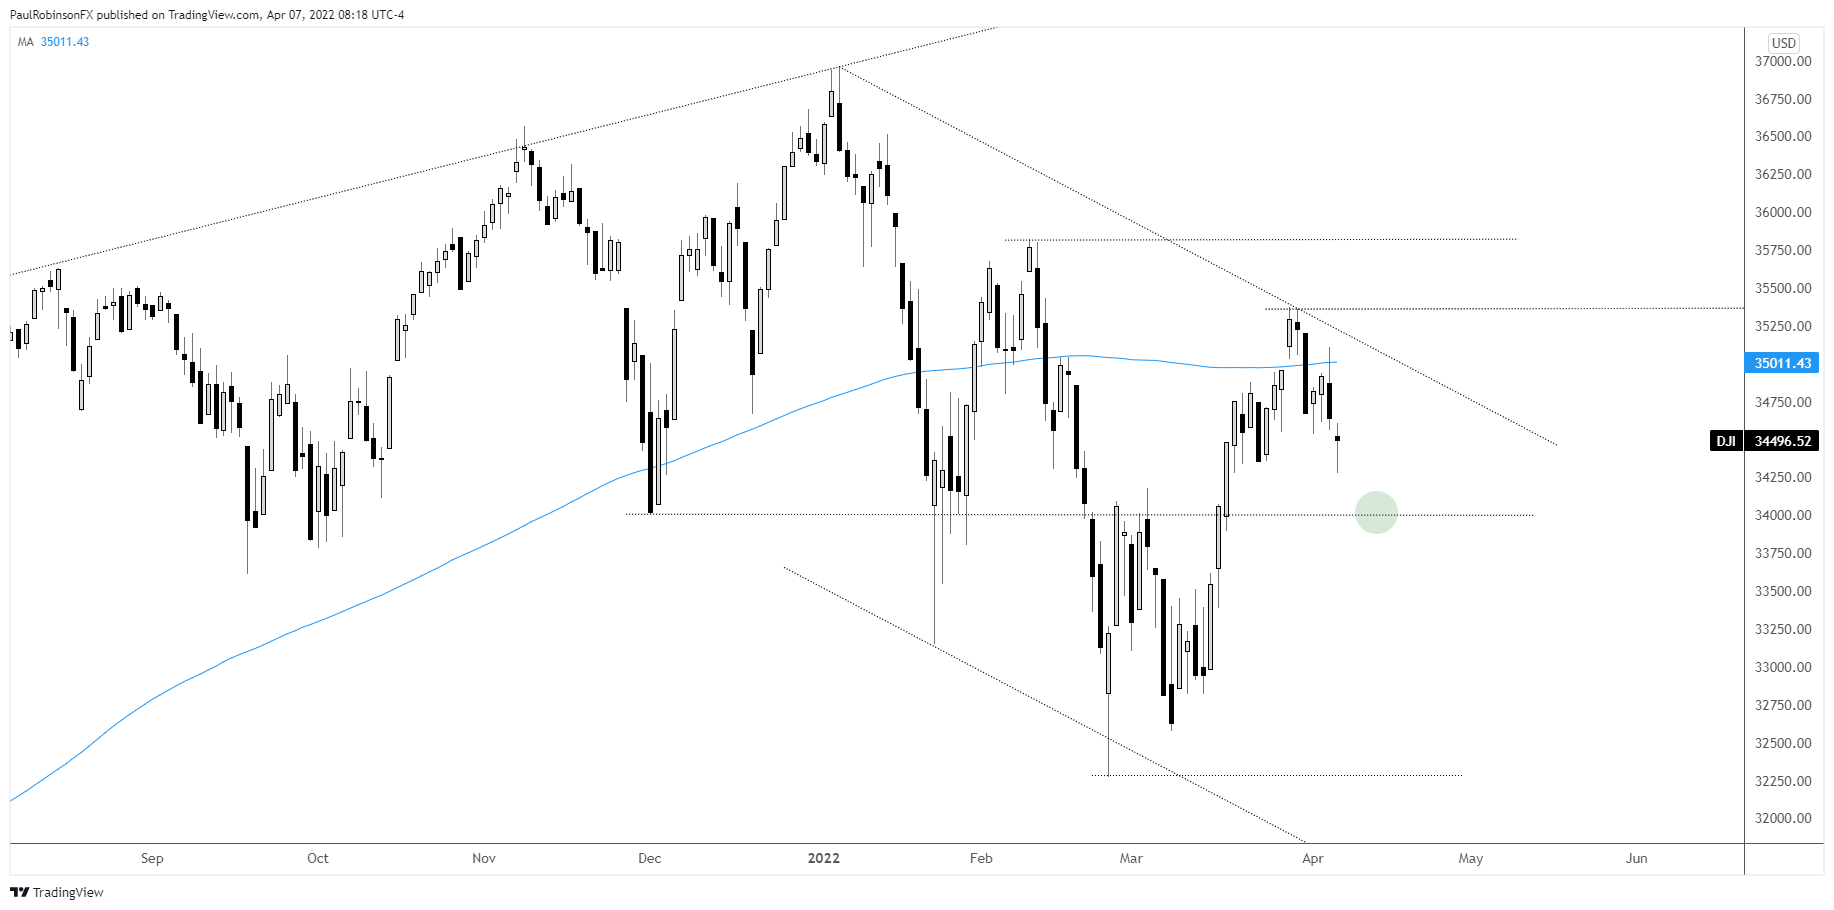
Dow Jones Chart by TradingView
Resources for Forex Traders
Whether you are a new or experienced trader, we have several resources available to help you; indicator for tracking trader sentiment, quarterly trading forecasts, analytical and educational webinars held daily, trading guides to help you improve trading performance, and one specifically for those who are new to forex.
---Written by Paul Robinson, Market Analyst
You can follow Paul on Twitter at @PaulRobinsonFX


