


U.S. Indices Technical Outlook:
- S&P 500 trading above resistance back to January
- Nasdaq 100 inching above the 200-day moving average
- Dow Jones also reclaimed its 200-day MA

Dow Jones, Nasdaq 100, S&P 500 Technical Outlook
The S&P 500 has been relentlessly pushing higher since the mid-March low, and on that it has cleared the 200-day with relative ease and now above another set of resistance from Jan/Feb around 4595. The market is extended, but it’s hard to fight strong upward momentum.
This doesn’t make for an easy position for those looking to enter long as a retracement could set in at any time, but shorting doesn’t have any appeal too in the absence of substantial resistance. A pullback and hold around 4595 could do some good for a continuation trade.
If this scenario is to unfold it would be ideal that the market rests for a few days on or above support. This would help work off short-term overbought conditions and provide a floor for assessing risk on new entries.
S&P 500 Daily Chart

The Nasdaq 100 just nudged above the 200-day moving average and is trading around the Feb peak at 15196. Momentum is strong, but we could see a retracement set in at any time. If long from lower levels, perhaps a trailing stop strategy would be a good idea. As far as new longs, looks best to wait, and as far as shorts are concerned nothing appealing about the current situation from where I sit.
Nasdaq 100 Daily Chart
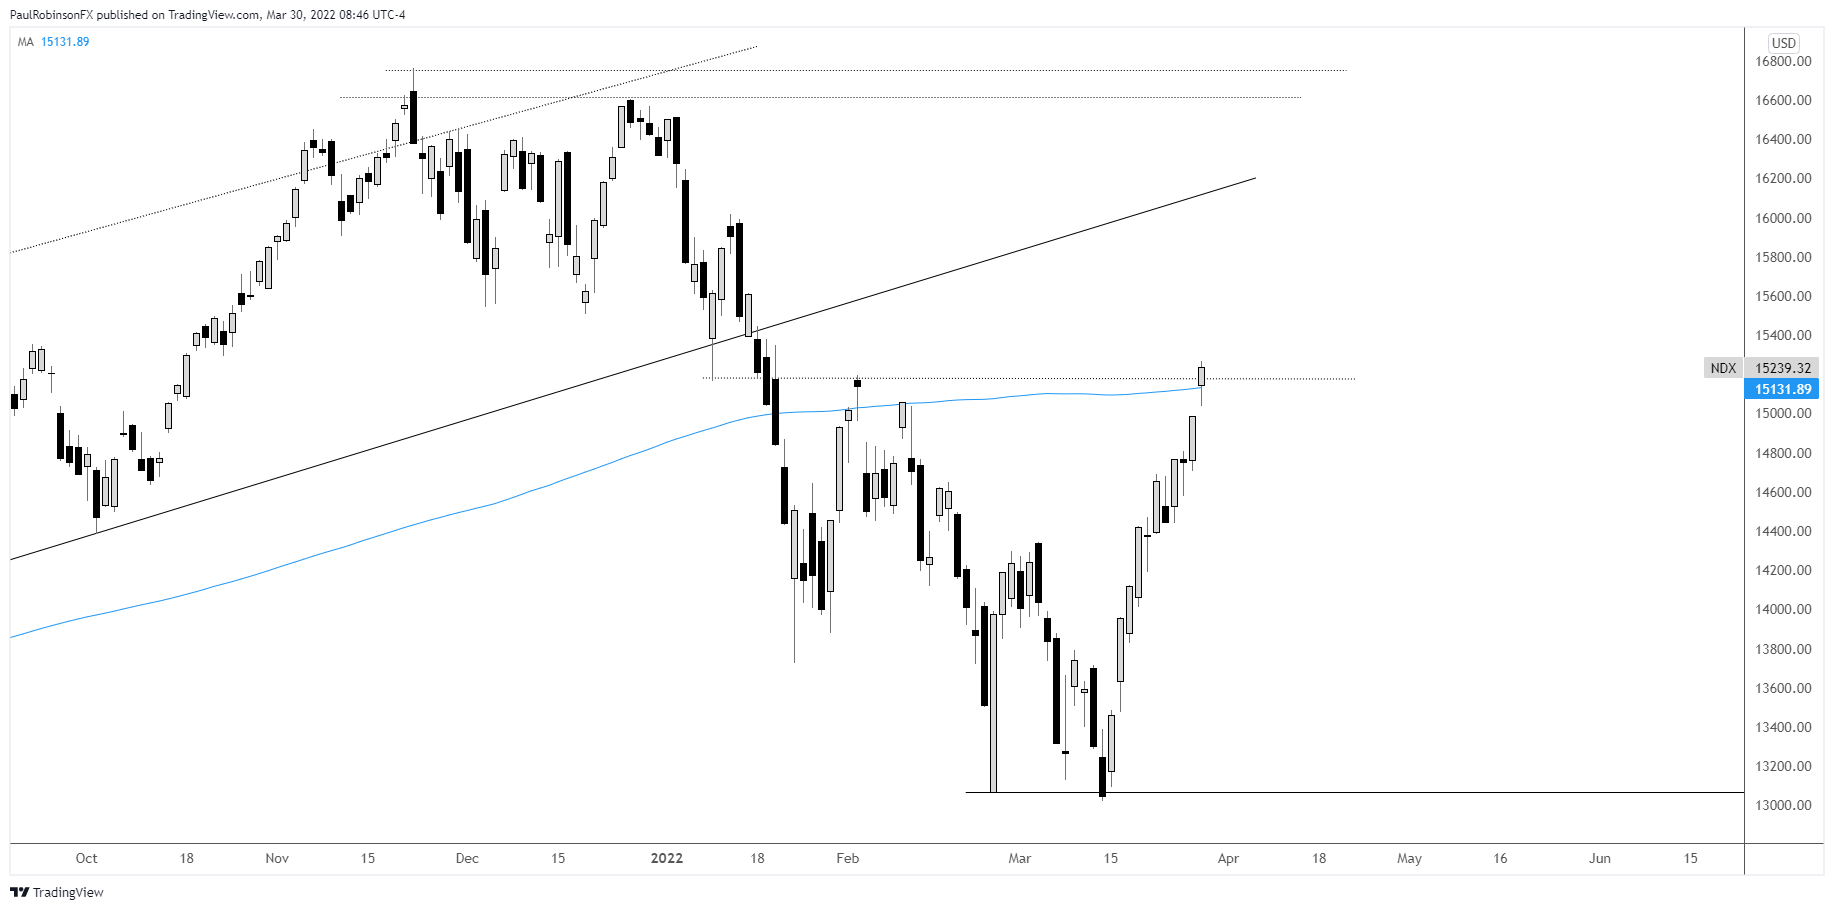
Nasdaq 100 Chart by TradingView
The Dow Jones also climbed above its 200-day yesterday, and on that it has room to go before it runs into its next level of resistance around 35824. If we see a run to that point and reversal on a failure to climb above, it could offer a short set-up. On a dip watch how price reacts to the 200-day retest. A period of consolidation above the 200 could do the Dow some good.
Dow Jones Daily Chart
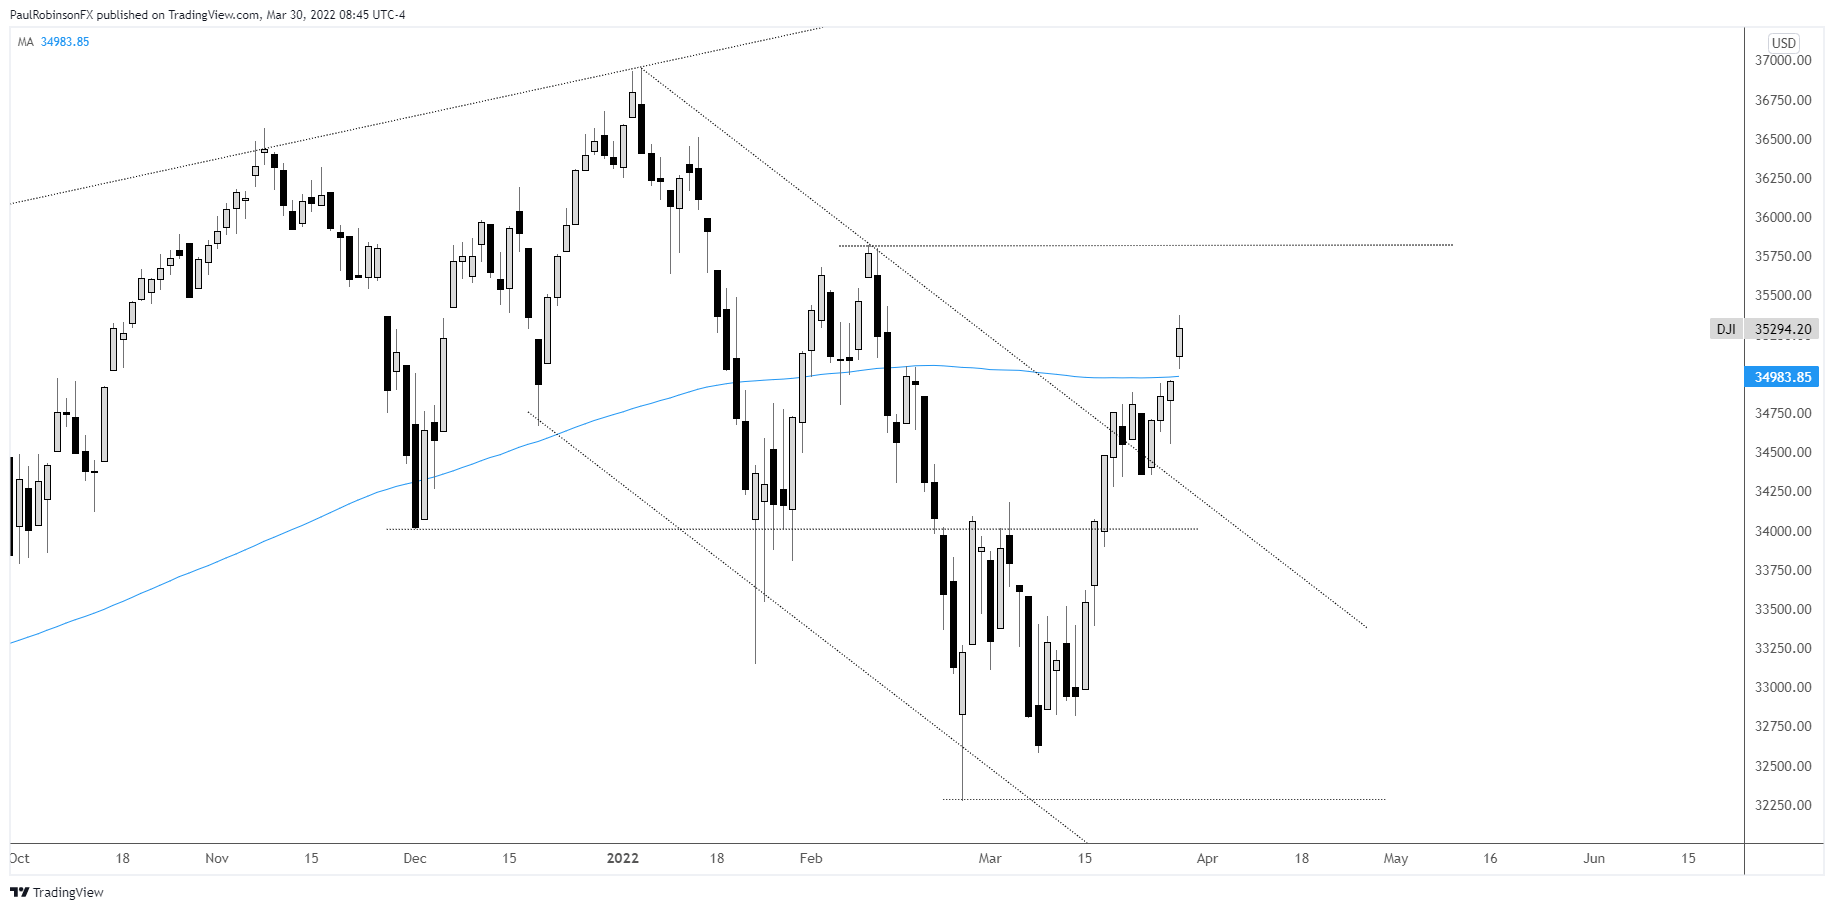
Dow Jones Chart by TradingView
Resources for Forex Traders
Whether you are a new or experienced trader, we have several resources available to help you; indicator for tracking trader sentiment, quarterly trading forecasts, analytical and educational webinars held daily, trading guides to help you improve trading performance, and one specifically for those who are new to forex.
---Written by Paul Robinson, Market Analyst
You can follow Paul on Twitter at @PaulRobinsonFX


