


U.S. Indices Technical Outlook:
- S&P 500 continues to demonstrate impressive relative strength
- Nasdaq 100 & Dow Jones also looking to make significant higher lowers
- A bounce in risk looks near, with the U.S. leading the way

Dow Jones, Nasdaq 100, S&P 500 Forecast: The Relative Strength Play
The S&P 500 continues to hold up well compared to other major stock markets that are more heavily impacted by the Russia/Ukraine situation. While Europe and Asia head to new depths during this crisis, U.S. stocks are demonstrating glaring relative strength. With the rest of the world getting into oversold territory, a bounce in risk appears near with the U.S. leading.
The DAX, CAC, FTSE, Nikkei and others have all been hammered in recent days, with price action turning panicky. A low here shortly (perhaps as soon as today), even if just an oversold bounce, should see the S&P 500 create a new near-term high above 4416 and move towards the 200-day moving average at 4466.
There lies a trend-line off the record high just below the long-term average. A rally into the 4425/4466 area will be an important test of the recent trend lower. We may see price stall and roll over at that juncture, but if developments turn more positive we may see initial resistance taken out in quick order.
A move below last week’s low at 4279 with momentum may mean that while the U.S. has been holding up relatively well, overall sentiment will get to even the strongest of markets and lead the S&P to a retest (or worse) of the Feb 24 low at 4114.
S&P 500 Daily Chart

The Nasdaq 100 may not see the 200-day moving average even if the above outlined scenario plays out as it lies all the way up to 15101. To reach the 200-day soon will likely require some positivity on the headline front. Just an oversold bounce in risk isn’t seen as being enough of a catalyst. The first line to watch is the trend-line from January and then the most recent swing-high at 14342.
Nasdaq 100 Daily Chart
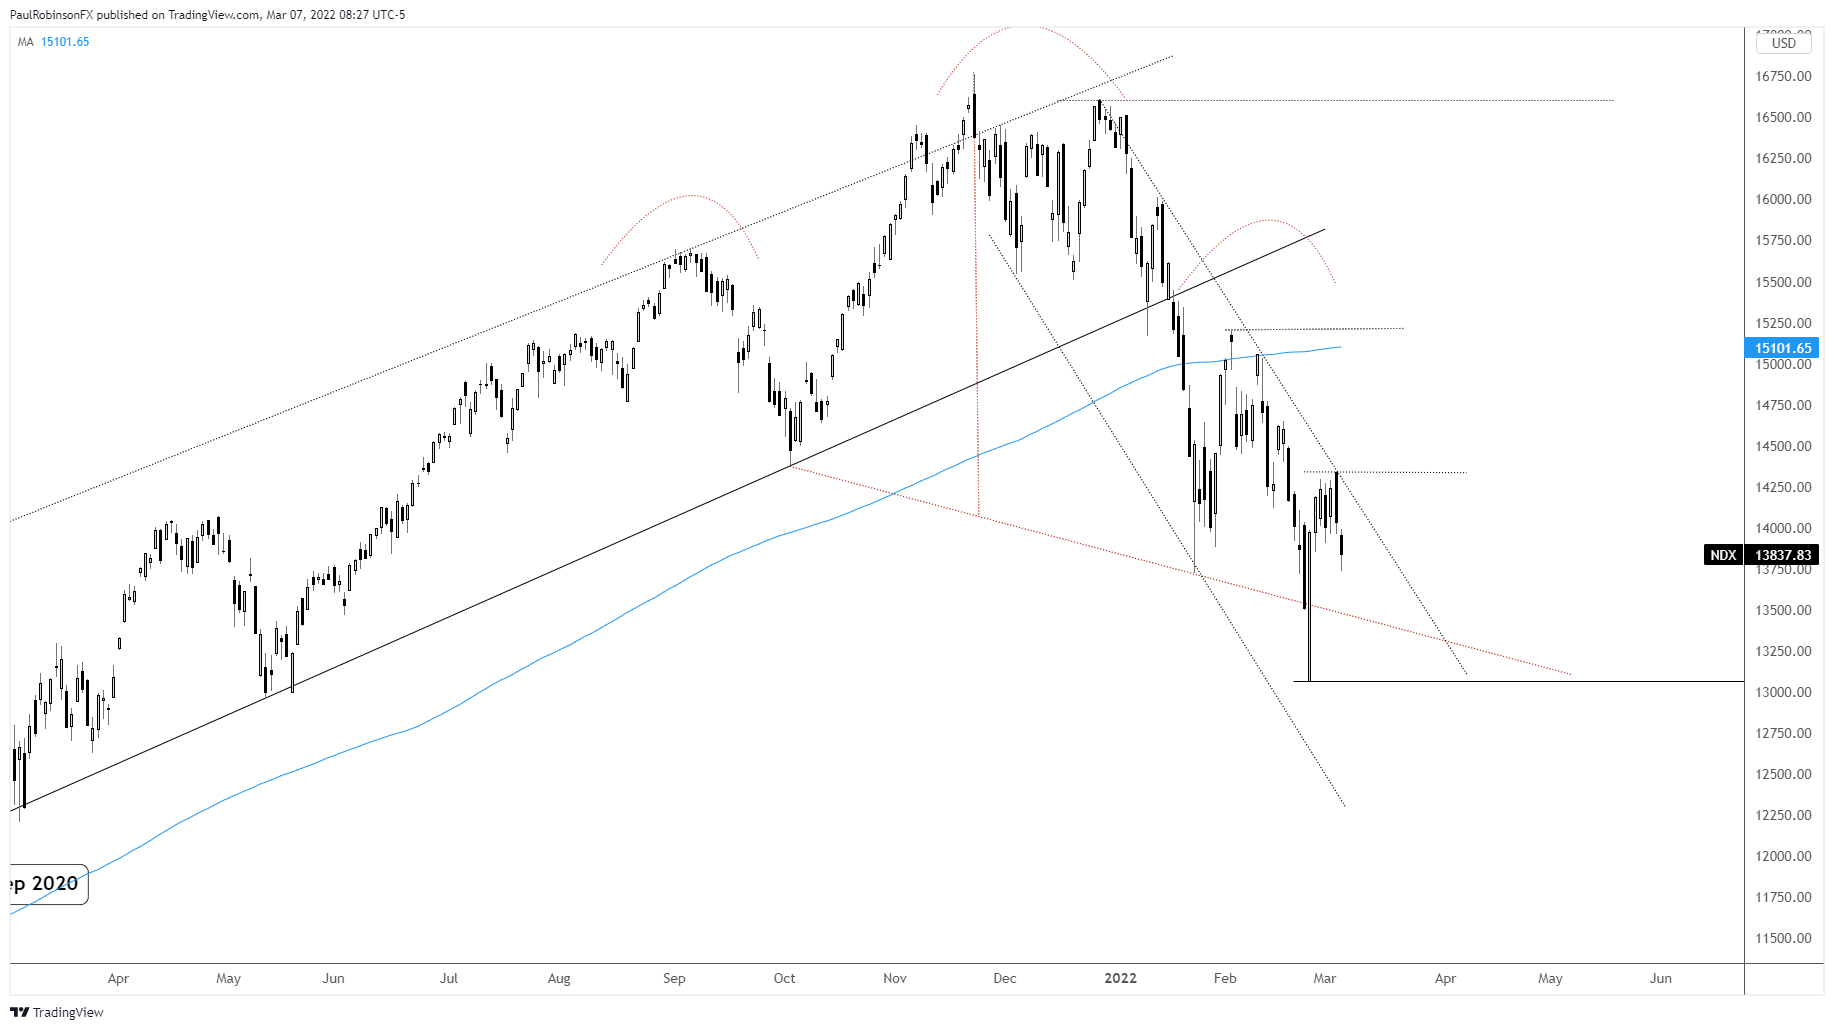
Nasdaq 100 Chart by TradingView
The Dow Jones is holding support around the 33150/300 area, a spot that extends back to last year. We may see this hold up as a higher low as soon as early this week. If the market can get into gear look for it to rally towards the trend-line off the Jan high and 200-day MA at 35022.
Dow Jones Daily Chart
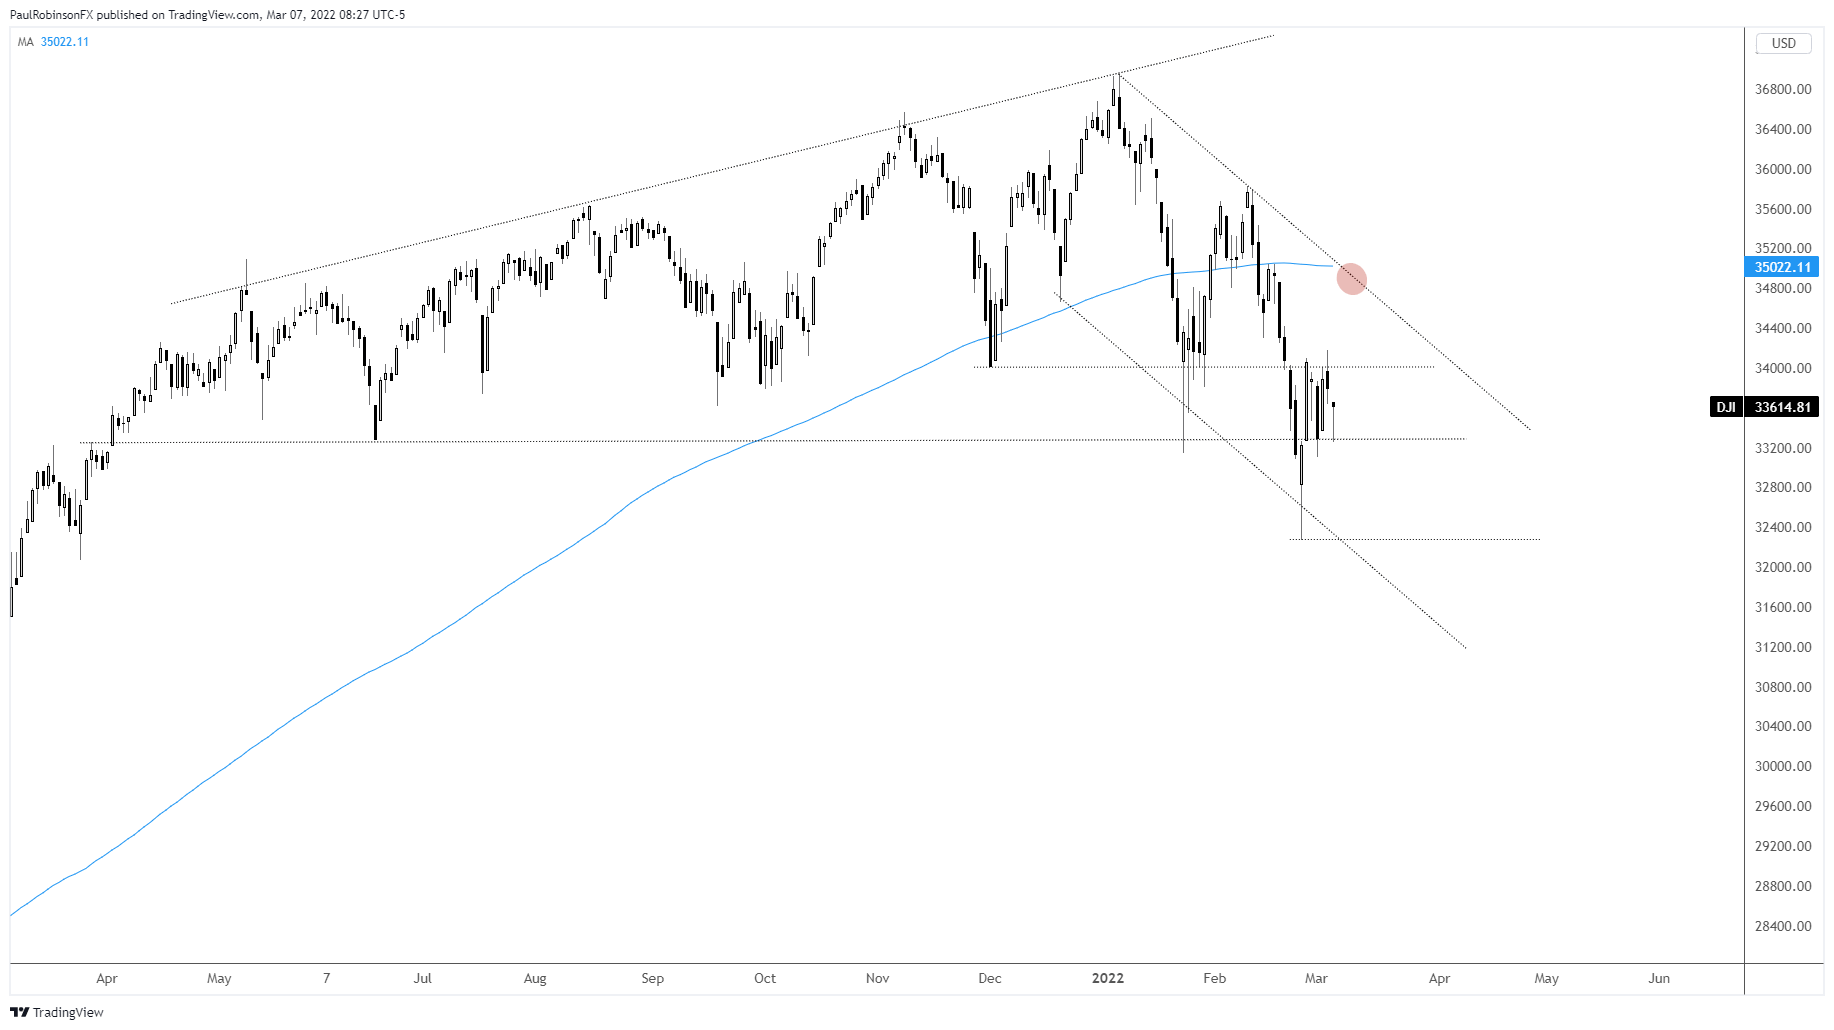
Dow Jones Chart by TradingView
Resources for Forex Traders
Whether you are a new or experienced trader, we have several resources available to help you; indicator for tracking trader sentiment, quarterly trading forecasts, analytical and educational webinars held daily, trading guides to help you improve trading performance, and one specifically for those who are new to forex.
---Written by Paul Robinson, Market Analyst
You can follow Paul on Twitter at @PaulRobinsonFX


