


S&P 500 Technical Price Outlook: Near-term Trade Levels
- S&P 500 technical trade level update – Daily & Intraday Charts
- SPX500 plunges towards key support at yearly lows- risk for deeper correction if broken
- Resistance 4363, 4450 (key), 4500 - Support 4245, 4197 (critical), 4117
The S&P 500 is trading lower again today with the index down four of the last five sessions. The decline takes SPX towards a key pivot zone as the bears go for a test of the yearly lows. These are the targets and invalidation levels that matter on the SPX500 technical price charts heading into the close of the week. Review my latest Strategy Webinar for an in-depth breakdown of this SPX500 setup and more.
S&P 500 Price Chart – SPX500 Daily
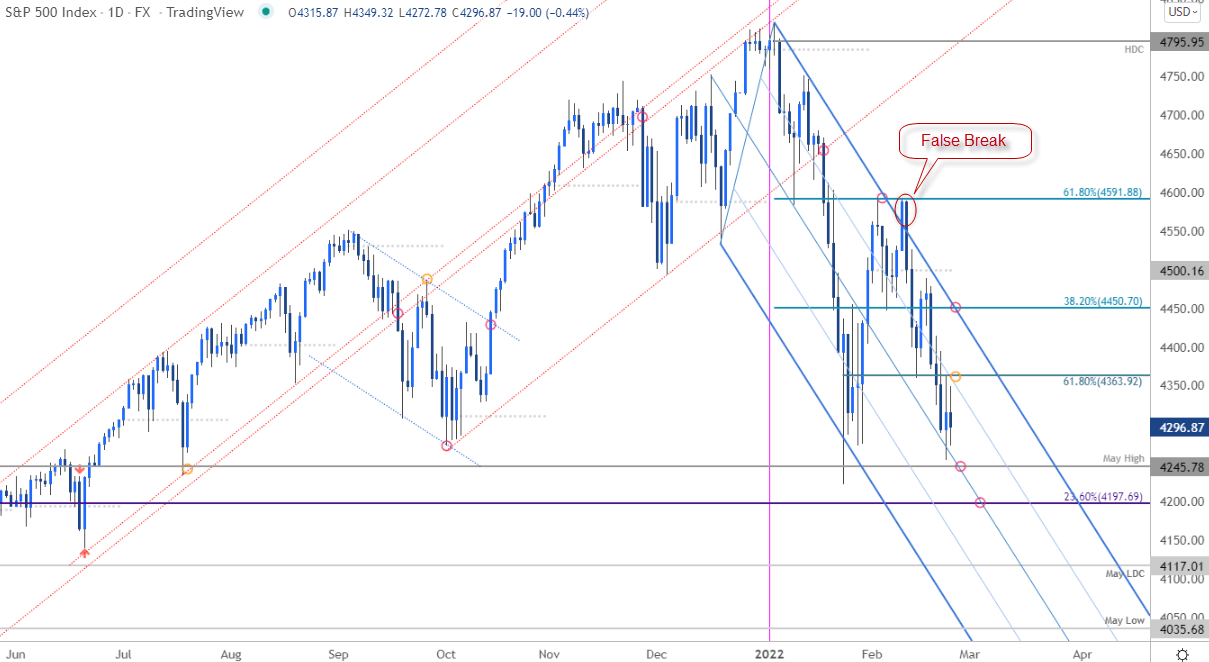
Chart Prepared by Michael Boutros, Technical Strategist; SPX500 on Tradingview
Technical Outlook: In my last S&P 500 technical outlook our bottom line noted that, “A recovery off downtrend support has us looking for a reaction into downtrend resistance” while highlighting that, “a breach / close above the upper parallel / 61.8% Fibonacci retracement of the yearly range at 4592 would be needed to suggest a more significant low is place / validate a larger reversal.” The index registered an intraday high at 4594 in the following days with three attempts failing before reversing sharply lower. The decline rebounded off the median-line yesterday before turning lower again today and the focus is on support at the May high at 4245.
S&P 500 Price Chart – SPX500 240min
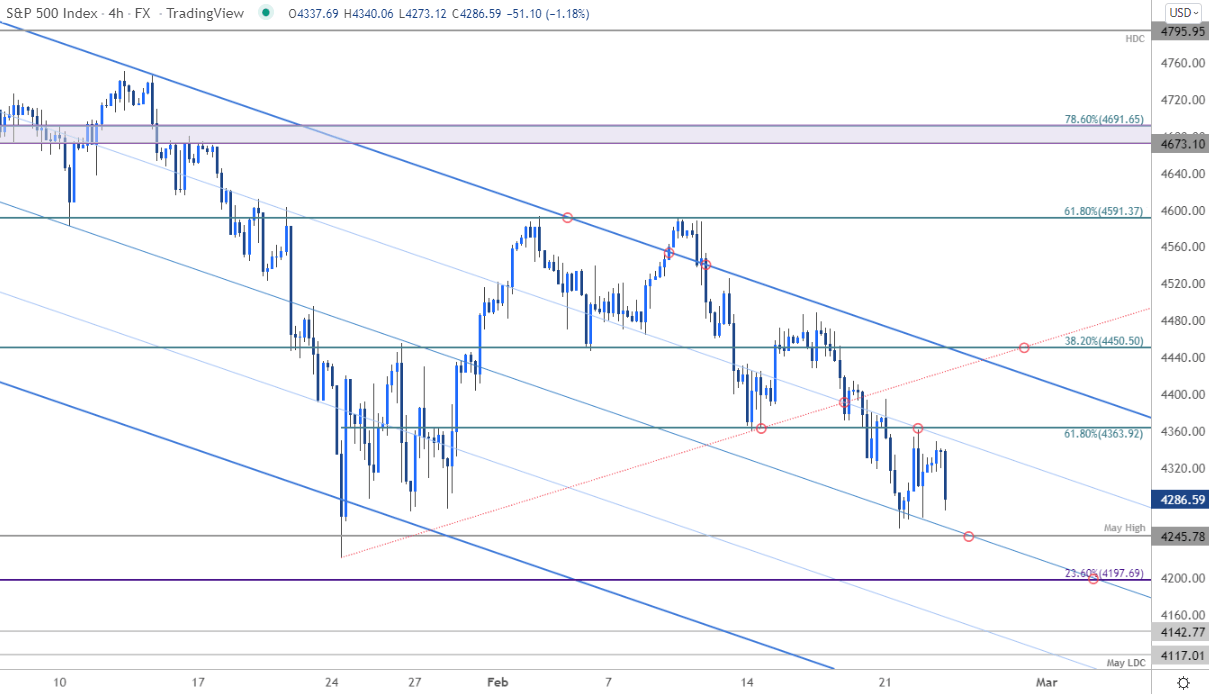
Chart Prepared by Michael Boutros, Technical Strategist; SPX500 on Tradingview
Notes: A closer look at SPX price action shows the index pivoting below the January trendline (red) with the decline now approaching confluent support into the May high / median-line at 4245. A more significant support zone rests just lower at the objective 23.6% retracement of the entire 2020 advanve at 4197- look for a larger reaction there for guidance IF reached (an area of interest for possible downside exhuastion). It’s important to note that weakness beyond this threshold would risk substantial losses for the index towards initial support objectives at 4142 and the May low-day close at 4117. Initial resistance now stands back at the 61.8% retracement of the late-January advance at 4363 with bearish invlaidation now lowered to 4450.

Bottom line: The S&P 500 sell-off is now approaching key support levels near the yearly range lows. From a trading standpoint, the threat remains for a deeper correction while below 4450 – look to reduce short-exposure / lower protective stops on a test of Fibonacci support with the risk for price inflection into this zone. Stay nimble heading into Friday with the US Core Personal Consumption Expenditure (PCE) likely to fuel some volatility into the close of the week. Review my latest S&P 500, Nasdaq & Dow Weekly Technical Forecast for a closer look at the longer-term SPX500 technical trade levels.
For a complete breakdown of Michael’s trading strategy, review his Foundations of Technical Analysis series on Building a Trading Strategy
S&P 500 Trader Sentiment – US500 Price Chart

- A summary of IG Client Sentiment shows traders are net-long the S&P 500- the ratio stands at +1.44 (59% of traders are long) – typically a weak bearishreading
- Long positions are5.06% higher than yesterday and 6.43% higher from last week
- Short positions are 2.68% higher than yesterday and 3.30% lower from last week
- We typically take a contrarian view to crowd sentiment, and the fact traders are net-long suggests US 500 prices may continue to fall. Traders are further net-long than yesterday and last week, and the combination of current positioning and recent changes gives us a stronger US 500-bearish contrarian trading bias from a sentiment standpoint.

US Economic Calendar

Economic Calendar - latest economic developments and upcoming event risk.
Active Technical Setups
- Australian Dollar Technical Outlook: Aussie Bulls Eye Key Resistance
- Canadian Dollar Technical Outlook: USD/CAD Coiling- Breakout Imminent
- Gold Price Technical Outlook: Gold Rally at Risk– War Bid Driver
- Euro Technical Price Outlook: EUR/USD Fades CPI Losses- Breakout Brewing
-Written by Michael Boutros, Currency Strategist with DailyFX
Follow Michaelon Twitter @MBForex


